Using the Pricing Sheet
The Pricing Sheet window allows capturing and pricing trades using predefined strategies based on your profile.
The Pricing Sheet window may contain multiple pricing sheets by currency pair. Each pricing sheet may contain multiple trades based on the selected strategy. Pricing Sheets are created on-the-fly, however the configuration is stored by the user.
Ⓘ [NOTE: The configuration of profiles and strategies is completely independent from the actual trade capture, and needs to be performed prior to capturing and pricing trade]
 See Configuring Profiles for details.
Contents
- Applying Trade Lifecycle Actions
- Running on-the-fly Risk Analyses
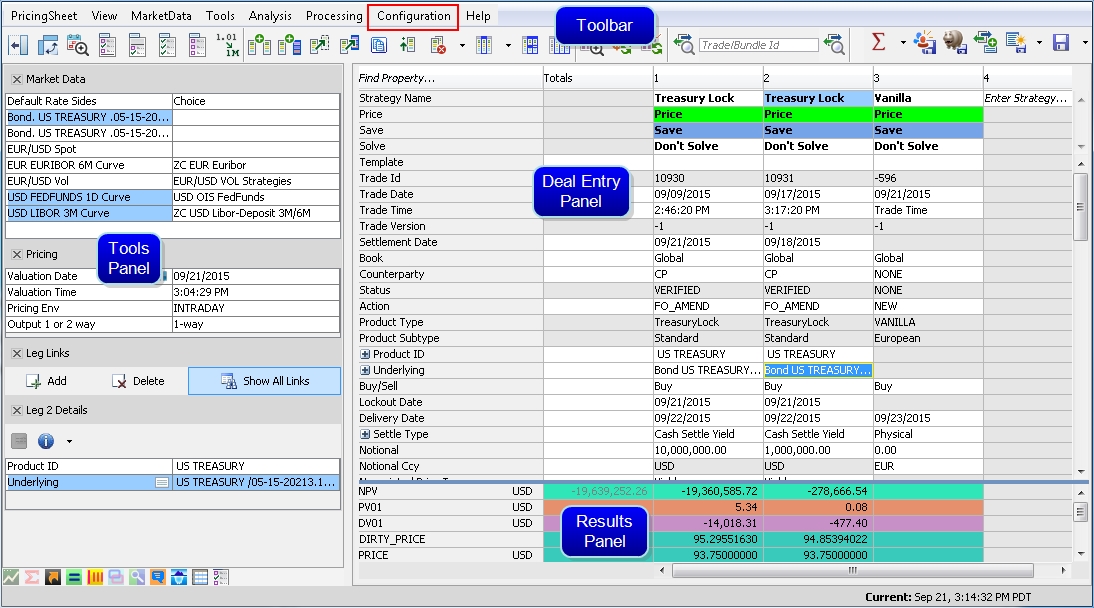
1. Tour of the Pricing Sheet
When you first open the pricing sheet, both the Tools Panel and Deal Entry Panel are empty of content. Before adding trades, certain user preferences need to be configured.
To get started, point to Configuration > Profile Configuration to configure profiles and strategies.
See Configuring Profiles for details.
Then choose Configuration > User Preferences to set general default values, select which pricer measures you wish to compute, and select which trade events columns you want to display.
See Setting User Preferences for details.
Once the Pricing Sheet is configured, you are ready to select a strategy to capture and price trades.
You can check which profile you are currently using by pointing to Configuration > Active Profile - Or you can select a different profile if one is available.
Pricing Sheet (Tour)
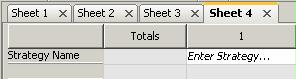
Adding Pricing Sheets
Aside from the ability to have several legs on one pricing sheet, you can also have multiple pricing sheets open in the Pricing Sheet window.
| • | Choose Pricing Sheet > New Sheet to add another pricing sheet panel. Click X to close the sheet. |
1.1 The Toolbar
A number of icons represent functions available directly from the Toolbar, most of which are also available in the menu items above. Right-click on the Toolbar to toggle on/off viewing of tool names.
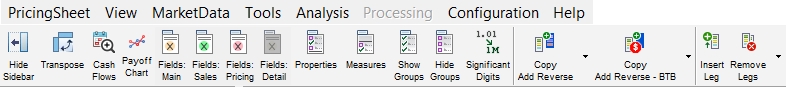
To select which icons are displayed on the Toolbar, choose the Toolbar tab in User Preferences.
1.2 The Tools Panel
The Tools Panel fills the left side of the Pricing Sheet window and provides a number of tools for working with trades. Certain default value settings can be found on the Defaults tab in the User Preferences window (Configuration > User Preferences).
| » | To open one of the tools, click the associated icon at the bottom of the panel. |
![]()
The tool's pane opens in the Tool Panel.
| » | To close the tool, click the icon again or use the X in the top left corner of the tool. |
Close window
| » | To simply hide the tool's content without closing the tool, click the name. Data fields are hidden while the tool's header remains on the panel. Click the tool name again to show content. |
Hide tool content
The following tools are available on the Tools Panel.
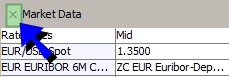
The Market Data tool shows market information used for pricing strategy legs in the Deal Entry Panel, such as spot rates, curves, and volatility surfaces.
| • | Click an item in the Market Data pane to open its definition window. You can also choose Market Data > Display in Market Data Manager to view all market data - click Help in the Market Data Manager's menu bar for more information. If you modify any market data in the Market Data Manager and wish to revert those changes, you can choose Market Data > Revert Pricing Env from the Pricing Sheet menu bar. |
TIP: To easily revert a market data value that was manually overridden in the Market Data tool, you can highlight the field and press the Delete key. The original value is restored.
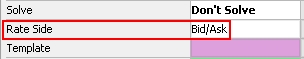
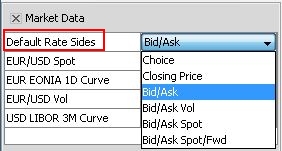
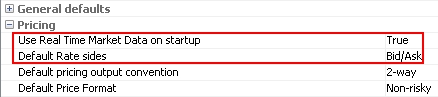
| • | The "Default Rate Sides" setting at the top of the tool pane controls whether a leg of a structure should be priced at mid or spread. This setting defaults to "Choice", however, the recommended setting is Bid/Ask. You can change the default setting on the Defaults tab in User Preferences. The following settings are available, with some variation among different strategies. |
| – | Choice - No spread is applied. |
| – | Closing Price - Pricing sheet uses the close sides of the quote set and the volatility surface to price deals. |
| – | Bid/Ask - Pricing sheet uses the bid and ask sides of the quote set and the volatility surface to price deals. |
| – | Bid/Ask Vol - Pricing sheet uses the bid and ask sides of the volatility surface and only the mid value of the quote set to price deals. |
| – | Bid/Ask Spot - Pricing sheet uses the bid and ask sides of the quote set and only the mid value of the volatility surface to price deals. |
| – | Bid/Ask Spot/Fwd - Pricing sheet uses the bid and ask sides of the quote set and will set spot, pips and other fields with bid/ask spread. The final price will be given as bid/ask spread calculated from the same choice Vol. |
This setting can also be set at the leg level. Use the Strategy Builder to add it to a custom strategy or add the "Rate Side" property to an out-of-the-box strategy in the Profile Configuration window.
If a two-way quote is used, the side of the quote used to generate the price will be boldfaced in the display.
The Pricing tool displays the valuation date, valuation time, the current pricing environment, and the pricing output.
| • | The Valuation Date defaults to the current day. Click the field to show the down arrow, and then click the arrow to display the calendar used to change the date. Using the pause-and-play icon beside Valuation Date, you can pause the Valuation Date and Time to keep market data at a certain date and time for pricing, and then restart date and time. |

| • | Click the Pricing Env field to change the pricing environment, and click the "Output 1 or 2 way" field to choose between 1-way and 2-way output for Bid/Ask pricing. |
Associated pricing functions.
| – | Click |
| – | Click |
| – | Choose Market Data > Check Pricing Env to check that all required market data are available in the pricing environment, and Market Data > Check Past Resets to check that all required fixings are available. |
ODA Shortcuts ![]()
The ODA Shortcuts icon provides quick access to the On Demand Analysis window.
| • | With the ODA Shortcuts tool open in the Tools Panel, click |
Solver ![]()
The Solver provides users with an analytics solver tool to solve for certain target values for a selected trade. For example, for an FX Option, you can solve for the strike value for a targeted customer premium.
Strip Generator ![]()
The Strip Generator allows you to generate a "strip", or new trade (or trades), based on the parameters of a reference single- or multi-leg trade.
| • | The reference trade is named the "Driver", and all trades generated from it are "strips". |
Leg Links ![]()
Leg Links allows you to link properties between individual legs and shows the relationships between them.
| • | Click |
Leg Details ![]()
Leg Details provides information on a highlighted strategy leg. The information fields vary from strategy to strategy.
| • | Click |
| • | Click |
| • | You can also right-click anywhere in the leg's properties and choose |
| – | Advanced Comments |
| – | Show Comments |
| – | Add Generic Comment |
| – | Trade Attributes (Trade Keywords) |
| – | Trade Fees |
| – | Trade Audit |
| – | Counterparty Info |
| – | BO Browser |
| – | BO Bundle Browser |
Comments ![]()
The Comment icon allows for adding and attaching comments to a trade leg.
| • | A user can also view a document attached to this comment. Click |
Underlying Details ![]()
Underlying Details provides details on assets underlying the trade.
| • | Click |
Rate Delta ![]()
Rate Delta displays Rate Delta sensitivity.
| • | Select the "Run Analysis" checkbox for sensitivity analysis. Click "X Cancel" to cancel analysis. |
Property Shortcuts ![]()
Property Shortcuts provide the ability to quickly show or hide groups of properties and pricer measures in strategy legs.
| • | Click |
| • | Click |
See Configuring Profiles for Properties Display Group details.
See Setting User Preferences for Pricer Measure Display Group details.
1.3 Keyboard Shortcuts
The following keyboard shortcuts can be used:
F Keys
| • | F3: Advanced Save |
| • | F5: Save |
| • | F6 (or Ctrl + T): New Sheet |
| • | F7: Add to Blotter Workspace |
| • | F8: Save/Update Workspace |
| • | F9: Solve |
| • | F10: Reserved for Pre-Deal Limit Check |
| • | F11: Strip |
| • | F12: Price |
Ctrl + Keys
| • | Ctrl + W: Close current sheet |
| • | Ctrl + K: Clear current sheet |
| • | Ctrl + F8: Open workspace |
| • | Ctrl + L: Remove current strategy |
| • | Ctrl + N: Advance cursor to Enter Strategy field in blank leg. |
| • | Ctrl + Tab/Shift: Move to previous/next sheet/tab |
| • | Ctrl + Space bar: Select current strategy |
| • | Ctrl + Home key: Go to cell "A1" and scroll back |
| • | Ctrl + Y: Exit Pricing Sheet |
| • | Ctrl + E: Toggle Events panel (See Viewing Trade Events below) |
| • | Ctrl + O: Open Trade in Excel (See Exporting Trade Strategies to Excel below) |
| • | Ctrl + T: New Sheet |
Alt + Keys
| • | Alt + Down/up Arrow: Open the drop down of the selected cell |
| • | Alt + F8: Save As New Workspace |
| • | Alt + T: Trade Details |
| • | Alt + K: Trade Attributes (Keywords) |
| • | Alt + F: Trade Fees Details |
| • | Alt + A: Audit |
| • | Alt + S: Counterparty Search |
| • | Alt + I: Counterparty Info |
| • | Alt + B: BO Browser |
| • | Alt + C: Generic Comment Report |
| • | Alt + R: Trade Tree |
| • | Alt + V: Add Generic Comment |
| • | Alt + X: BO Bundle Browser |
Others
| • | Home button: Go to top of current column |
| • | End: Go to bottom of current column |
2. Capturing Trades
Open or select a pricing sheet.
In the pricing sheet panel, select a strategy from the "Strategy Name" property - You can select out-of-the-box strategies, or custom strategies.
Ⓘ [NOTE: The list of strategies available for selection depends on your profile - See Configuration > Profile Configuration for details]
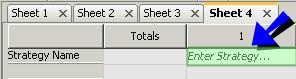
Pricing sheet (select strategy)
A strategy can contain multiple trades that will appear as multiple columns in the pricing sheet panel. You can click ![]() to display the strategies as rows rather than columns.
to display the strategies as rows rather than columns.
Click here for a description of out-of-the-box strategies.
Click here for information on building custom strategies.
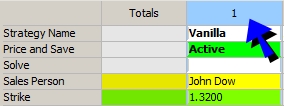
Once you select a strategy, all properties defined for that strategy appear, and are ready for capture.
Ⓘ [NOTE: If the properties do not appear, they may belong to a display group that is not selected for display - Display groups are defined as part of your profile - You can click ![]() to select which groups you want to display. Display groups are defined using Configuration > Profile Configuration]
to select which groups you want to display. Display groups are defined using Configuration > Profile Configuration]
You can also capture additional information on trades like cash settlement info, rate schedules, amortization schedules, exercise schedules, etc. Right-click a trade and choose "Supplemental" to display supplemental details.
Click here for a complete description of all properties and supplemental details.
Once the properties are set, you can perform any of the following functions:
| • | Selecting Trades |
| • | Adding and Removing Trades |
| • | Pricing Trades |
| • | Solving |
| • | Saving Trades |
| • | Viewing Trade Details |
| • | Viewing Trade Events |
| • | Loading Saved Trades |
| • | Applying Trade Lifecycle Actions |
| • | Running on-the-fly Risk Analyses |
2.1 Selecting Trades
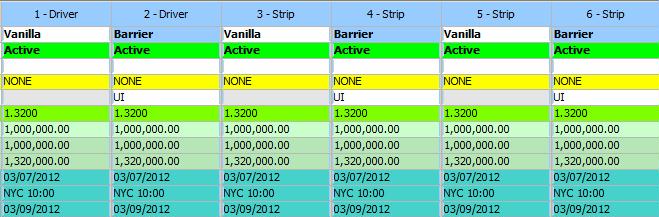
To select a trade in a pricing sheet, you can click the trade heading. A light blue frame appears around the trade to indicate that it is selected.
Pricing sheet (select trade)
You can also click ![]() to select trades in bulk - Multiple options are available.
to select trades in bulk - Multiple options are available.
Cell Selection
You can also select the trade where your cell selection is - Click ![]() to select the trade where the cell selection is.
to select the trade where the cell selection is.
Pattern Selection
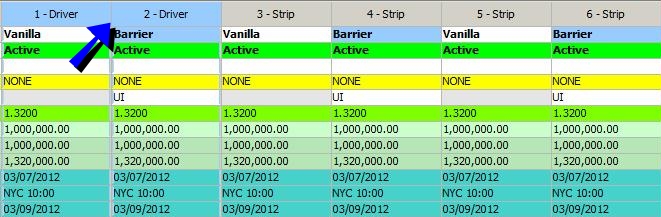
When you have a strip of options or a strategy with multiple legs, you may want to select all the legs that have the same pattern.
First, you select the columns that determine the pattern.
Then you click ![]() to select any other column that fits the pattern.
to select any other column that fits the pattern.
Here is an example - Select columns 1 and 2 to determine a pattern. When clicking ![]() it also selects the other columns because they fit the same pattern.
it also selects the other columns because they fit the same pattern.
2.2 Adding and Removing Trades
When you select a strategy, it comes with a default number of trades (also referred to as legs). You can add and remove trades as needed. The following functions are available.
| Functions | Description | |||||||||||||||||||||||||||||||||||||||
|---|---|---|---|---|---|---|---|---|---|---|---|---|---|---|---|---|---|---|---|---|---|---|---|---|---|---|---|---|---|---|---|---|---|---|---|---|---|---|---|---|
|
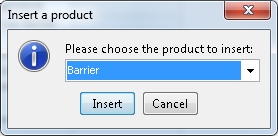
Insert Leg |
Clicking
Using the down arrow, select a strategy and click Insert. A new column is added for the strategy. Alternatively, you can right-click any active trade heading and select Insert Strategy. Remove Strategy and Reload Strategy options are also available. The Insert Leg command is also available under View in the menu bar. |
|||||||||||||||||||||||||||||||||||||||
|
Copy Add |
These commands can also be accessed from the menu bar by selecting Tools > Copy. TIP: To prevent certain trade keywords from being copied to a new leg, list those keywords under the domain name PricingSheetKeywordsToClearUponCopy. |
|||||||||||||||||||||||||||||||||||||||
|
Remove Legs |
Select one or multiple trades, and click
The Remove Legs command is also available under View in the menu bar. |
 Copy Add Reverse - Copies the trade, adds it, reverses buy to sell and vise versa.
  Copy Add - Copies and adds the trade. The reconvention that exists in the original trade will not be copied to the new trade.
 Copy Replace - Copies over a saved trade in the same column and removes the trade ID and resets the Action property to NEW. Consequently, it is treated as a new trade.
 Copy Reverse - Copies over the trade in the same manner as above, and reverses buy to sell and vice versa.
 Copy To New Sheet - Copies the trade to a new pricing sheet.
 Copy Reverse To New Sheet - Copies the trade to a new sheet, and reverses buy to sell and vise versa.
 Copy Selected To Clipboard - Copies the selected parts of a trade to the clipboard.
 Copy Add Reverse - BTB - Copies the trade, adds it, reverses buy to sell and vise versa, without resetting the premium.
  Copy Add - BTB- Copies and adds the trade without resetting the premium.
 Copy Replace - BTB - Copies over a saved trade in the same column and removes the trade ID and resets the Action property to NEW, without resetting the premium. Consequently, it is treated as a new trade.
 Copy Reverse - BTB - Copies over the trade in the same manner as above, and reverses buy to sell and vice versa, without resetting the premium.
 Copy To New Sheet - BTB - Copies the trade to a new pricing sheet without resetting the premium.
 Copy Reverse To New Sheet - BTB - Copies the trade to a new sheet, and reverses buy to sell and vise versa, without resetting the premium.
2.3 One-Click Shortcut Actions for Adding and Opening Trades
The features below provide shortcuts for various trade related actions in the Pricing Sheet.
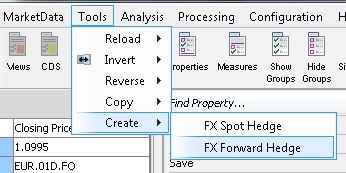
Creating FX Spot/Forward Hedge Trades
You can create one-click FX Spot Hedge and FX Forward Hedge trades on an individual option or on multiple options at once. The options must be priced before creating a hedge.
| » | To create an FX Spot Hedge or FX Forward hedge on an individual option, you can right-click the trade leg, point to Create, and select the preferred type of hedge from the menu. |
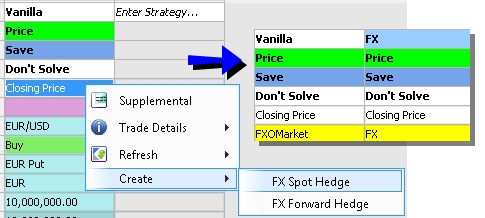
A new leg is added on the Pricing Sheet for the hedge.
| » | To create multiple hedges on multiple trades, highlight all relevant trades in the Pricing Sheet, select the Tools menu, point to Create, and select the preferred type of hedge from the menu. |
For details on making FX Hedge user default settings, see Defaults Panel in the Setting User Preferences documentation.
Feature for Opening FX Option Parent/Child Trades
For quick access to related trades associated with a barrier trade knock-in or an exercised spot trade, You can right-click a trade and directly open the associated trade in the Pricing Sheet.
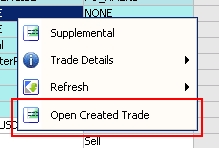
This feature is made available in the following two scenarios.
| • | For a barrier option that’s been knocked in, or a vanilla option that’s been exercised, you can right-click the trade to open its "child" trade. |
| • | For a vanilla option created when a barrier was knocked in, or a spot trade that was created when an option was exercised, you can right-click the trade to open its "parent" trade. |
2.4 Pricing Trades
| » | Click |
The pricer measures selected under Configuration > User Preferences are computed and displayed in the Results Panel.
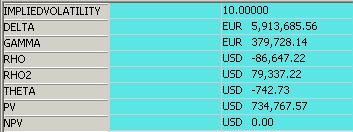
Pricing sheet (pricing results)
| » | You can select "Display Pricer Measures" in the Pricing Sheet's View menu, or click |
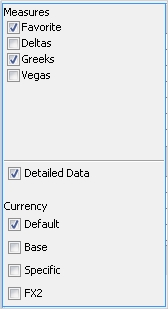
Select the checkboxes that apply to the measures you want added.
Measures
By default, only favorite pricer measures are displayed.
| • | Check other display groups as needed. |
| • | Check "Detailed Data" to display pricing results per leg. |
Currency
By default, the pricer measures are displayed in the currency selected under Configuration > User Preferences.
| • | Check "Default" to display the pricer measures in the risky currency set in the currency pair definition. |
| • | Check "Base" to display the pricer measures in the base currency of the pricing environment. |
| • | Check "FX2" to display the pricer measures in the other currency of the currency pair. |
The following option is also available in the Pricing window:
| Option | Description | ||||||
|---|---|---|---|---|---|---|---|
|
Output 1 or 2 Way |
By default, the pricer measures are computed using mid quotes. You can select:
|
| » | Depending on the pricer model and strategy, double-clicking certain pricer measures will display more pricing details on that measure. To enable this feature for a supported pricer measure, you can add the pricer measure to the domain name PricingSheetViewerMeasures. |
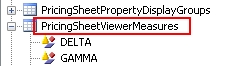
For details on adding domain values, see Defining Domain Data.
Calculating Initial Margin
Optional module Margin Engine.
If you have enabled IM calculation in the User Preferences, you can choose ![]() > Price & Calc IM to calculate initial margin requirements.
> Price & Calc IM to calculate initial margin requirements.
Please refer to Calypso Margin Engine documentation for complete setup and usage details.
Calculating XVA and MCPFE
Optional module Monte Carlo XVA.
If you have enabled XVA calculations in the User Preferences, you can choose ![]() > Price & Calc XVA or
> Price & Calc XVA or ![]() > Calc XVA to calculate XVA and MC PFE.
> Calc XVA to calculate XVA and MC PFE.
After calculating XVA, double-clicking the XVA measures reveals a panel that displays supplementary results, including a profile chart and graph. (This panel contains identical output as compared to the CCR Viewer panel.)
Please refer to Calypso Monte Carlo XVA documentation for complete XVA setup and usage details.
Please refer to Calypso Monte Carlo PFE documentation for complete MC PFE setup and usage details.
Calculating SA-CCR
Optional module Regulatory Risk.
If you have enabled SA-CCR calculations in the User Preferences, you can choose ![]() > Price & Calc SA-CCR to instantiate the SA-CCR result integration.
> Price & Calc SA-CCR to instantiate the SA-CCR result integration.
Please refer to the Regulatory Risk SA-CCR documentation for complete SA-CCR setup and usage details.
2.5 Saving Trades and Hypothetical Trades
You can only save trades where the "Price and Save" property is set to "Active".
Click ![]() to save trades, or
to save trades, or ![]() to save hypothetical trades.
to save hypothetical trades.
If you click the down arrow next to the Save ![]() button, you can select Advanced Save
button, you can select Advanced Save ![]() - See details below.
- See details below.
You can click the ![]() button to add the trade to the Trade Blotter. You will be prompted to select a blotter workspace.
button to add the trade to the Trade Blotter. You will be prompted to select a blotter workspace.
The trade keyword StrategyType contains the name of the strategy and the IDs of the trades in the strategy, as in the example shown below:

Upon saving out-of-the-box strategies, separate trades are saved by default, and no bundle is created.
Upon saving custom strategies, the default behavior comes from the Strategy Builder.
Ⓘ [NOTE: To change the default values for both out-of-the-box strategies and custom strategies, you need to use the Advanced Save, provided the fields are configured in the Strategy Builder as available and user editable for that strategy - Please refer to the Calypso Pricing Sheet Setup Guide for details]
Advanced Save - New Trades
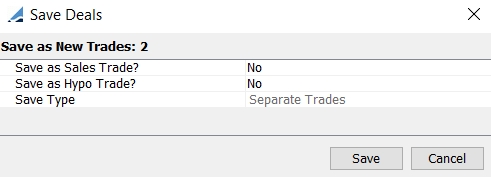
Advanced Save - New trades
| » | Review the fields described below and click Save. |
| Fields | Description | ||||||||||||||||||||||||
|---|---|---|---|---|---|---|---|---|---|---|---|---|---|---|---|---|---|---|---|---|---|---|---|---|---|
|
Save as Sales Trade? |
Defaults to the "Sales Mode" parameter set in the Defaults panel under Configuration > User Preferences. If Yes, the trade keyword "ScratchPadTrade" is set to true - This keyword can be used in the workflow configuration to set a specific workflow status. Otherwise, the system assigns the trade status based on the default workflow. |
||||||||||||||||||||||||
| Save as Hypo Trade? |
If Yes, the trade keyword "HypotheticalTrade" is set to true - This keyword can be used in the workflow configuration to set a specific workflow status. Otherwise, the system assigns the trade status based on the default workflow. |
||||||||||||||||||||||||
|
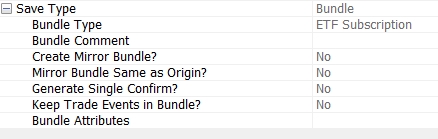
Save Trades in a Bundle? |
The Save Type is set by default to "Separate Trades" for out-of-the-box strategies, or comes from the Strategy Builder for custom strategies. It can be modified if you have configured persistence settings in the Strategy Builder for that strategy, and if it is available and user editable.
The bundle name will be created by the system as "<bundle type>-<bundle number>" - The bundle number is given by the system. Bundle Parameters
The name of the mirror bundle will be created by the system as "Mirror Bundle <bundle name>". This only applies if all the trades/legs are internal trades/legs.
Select Yes to add the mirror trades to the same bundle as the original trades instead of the mirror trade bundle. You also need to add the value “MirrorBundle to the domain "TradeBundleAttributes".
Ⓘ [NOTE: If the trade cache contains more than 20000 trades, we do not scan the cache when saving a trade bundle, but perform a SQL request to get the identifiers of the trades belonging to the trade bundle. This limit can be overridden using the domain “TradeCacheLimitSizeForBundleSearch”] |
Advanced Save - Existing Trades
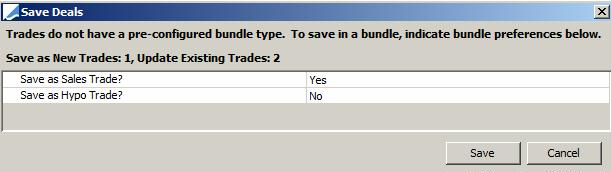
Advanced Save - Existing trades
| » | Review the fields below and click Save. |
For custom strategies, the fields default to the settings of the Strategy Persistence settings.
| Fields | Description |
|---|---|
|
Save as Sales Trade? |
Defaults to the "Sales Mode" parameter set in the Defaults panel under Configuration > User Preferences. If Yes, the trade keyword "ScratchPadTrade" is set to true - This keyword can be used in the workflow configuration to set a specific workflow status. Otherwise, the system assigns the trade status based on the default workflow. |
| Save as Hypo Trade? |
If Yes, the trade keyword "HypotheticalTrade" is set to true - This keyword can be used in the workflow configuration to set a specific workflow status. Otherwise, the system assigns the trade status based on the default workflow. |
Sample Workflow
2.6 Generating Trade Strips
The strip of Pricing Sheet trades is built from one or several driver trades by simple repetition or using a schedule. Any link or shortcut defined on the driver trades can be copied to the strip. In addition, links can be defined on the strip on-the-fly.
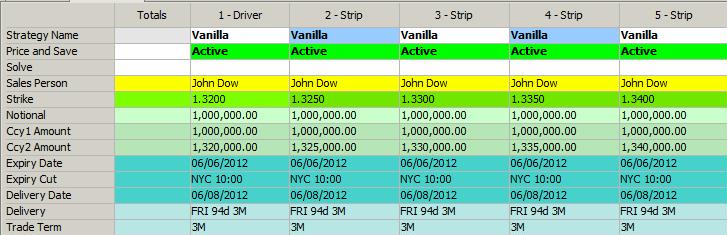
Following is an example of how to capture a strip of FX options in the Pricing Sheet.
| » | Capture a trade in the Pricing Sheet. |
| » | In the Strip Generator window, click a leg, or "All legs". These are the driver trades. |
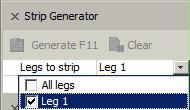
| » | Then click OK. |
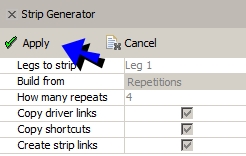
The Strip Generator window will show the following options:
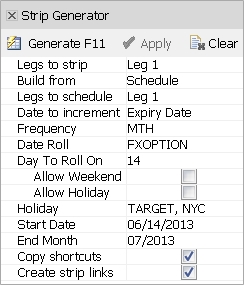
| » | Select Repetitions or Schedule. |
| – | For Repetitions, enter the number of trades you want to add to the strip. |
| – | For schedule, define the schedule. |
Check or clear "Copy shortcuts" to copy any solving shortcuts to the strip.
See Solving Shortcuts for details.
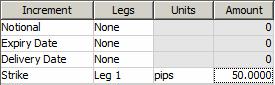
Check or clear "Create strip links" to create links on-the-fly - You can setup the links in the "Increment" table.
For example, you can increment the strike of the strip legs by 50 pips from the first leg.
| » | Click Generate when your strip definition is ready - The trades are generated accordingly. |
| » | Once the trades have been generated, click Apply for the generated trades to take effect. |
2.7 Viewing Trade Details
Click ![]() to display the Leg Details window.
to display the Leg Details window.
Supplemental Information
Click ![]() to display supplemental information like cash settlement info, rate schedules, amortization schedules, exercise schedules, etc.
to display supplemental information like cash settlement info, rate schedules, amortization schedules, exercise schedules, etc.
This is described as part of the trade capture.
Click here for details.
Trade Details
Select one or multiple trades and click ![]() in the Leg Details window.
in the Leg Details window.
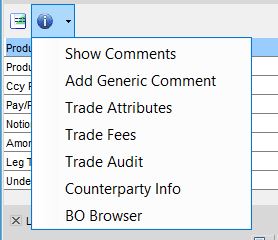
You can choose to display:
| • | Show Comments - Selecting this menu item opens the Generic Comment Report. |
For details on this report, see Generic Comment Report.
| • | Add Generic Comment - Opens the "Add generic comment" window. |
For details on this window, see "Add Generic Comment" in the File Menu documentation.
| • | Trade Attributes - (Also called trade keywords) Opens the Trade Attributes pop-up window, where you can assign values to trade attributes. |
For details, see Defining Trade Keywords.
| • | Trade Fees - Opens the Trade Fees Details window. |
For details, see Capturing Trade Fees.
| • | Trade Audit - Opens the Trade Audits window. |
For details on this window, see "Trade Audit" in the File Menu documentation.
| • | Counterparty Info - Opens the "Counter Party" window, which corresponds to the Legal Entity window. |
For details, see Defining Legal Entities.
| • | BO Browser - Opens the Back Office Browser, which is used for viewing back office activity and applying actions to trades. |
For details, see Back Office Browser.
Right-Click Menu
Right-click a trade in the Pricing Sheet to open the Trade Shortcuts menu.
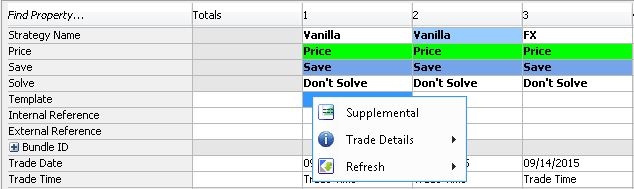
The menu provides quick access to Supplemental Information, Trade Details, and Refresh options (View > Refresh) for a specific trade.
| • | Supplemental: provides access to the same supplemental information as described above. |
| • | Trade Details menu: provides access to the same Trade Details items as described above. |
| • | Refresh menu: includes Refresh Quotes, Refresh Market Data, Refresh All Market Data (refreshes both quotes and market data), Refresh Price, and Freeze Price. |
2.8 Viewing Trade Cash Flows
Click ![]() to display the Trade Cash Flows panel, or choose View > Cash Flows.
to display the Trade Cash Flows panel, or choose View > Cash Flows.
It displays cashflows and fees.
Trade Events panel
You can choose the columns to be displayed in the Cash Flows panel under Configuration > User Preferences.
| » | You can select the column headings and set filters as needed to filter the trade events. |
You can click ![]() to clear all the filters.
to clear all the filters.
| » | You can click |
| » | You can check the Edit checkbox to customize the cashflows. The property "Custom Cashflows" will be set to "true". |
You can use the ![]() and
and ![]() icons to undo edits for selected columns or all edits, as needed.
icons to undo edits for selected columns or all edits, as needed.
| » | You can right-click to Export to Excel. |
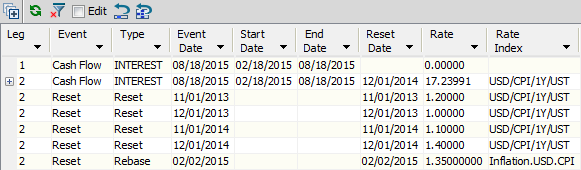
| » | You can view Sample Values for any "Cash Flow" Event with the Type "INTEREST" for any float swap leg. If available, click the expand button to the left of the cashflow to view the known and forecasted rates that went into the final calculated rates shown on the cashflows. The following columns are displayed: |
| – | Sample Type - Averaging, Compounding, or Inflation. |
| – | Sample Date - Observation Date of the Fixing, equivalent to the Reset Date of the Fixing. |
| – | Rate - The Known Rate from Quote Set, if Val Date is earlier than Sample Date and Quote Value exists in Quote Set. |
| – | Weight - [Percentage Weight of Period End - Period End] for Averaging and Compounding. For Inflation, it is always 1. |
| – | Period Start - The Accrual Period Start associated with this Fixing. |
| – | Period End - The Accrual Period End associated with this Fixing. |
| – | Proj. Rate - The Project Rate from the Forecast Curve, if Val Date is later than Sample Date. Not valid for Inflation. |
| – | Rate Index - The Rate Index of the Fixing. |
| – | Total Rebase Factor - The product of all rebase factors that apply to the given Inflation Fixing. Only valid for Inflation. |
| – | Rebase Rate - [Rate / Total Rebase Factor] for the given Inflation Fixing. |
2.9 Viewing Strategy Attributes
You can add strategy attributes to a pricing sheet provided you have defined them.
Please refer to the Calypso Pricing Sheet Setup Guide for information on defining strategy attributes.
Once defined, you can add them to a strategy in the Profile Configuration window.
2.10 Loading Saved Trades
You can load saved trades and bundles into the pricing sheet using one of the following methods.
Ⓘ [NOTE: Entering and saving a trade on today's date and entering the trade Id in the "Trades From" field will not include the target trade in the search results. Search datetime is set to 1 second after midnight of the "Trades From" date]
Loading a saved or bundle ID and modifying the trade or bundle will add a * to the leg number. This indicates a value has been changed on the leg.
Loading Saved Trades
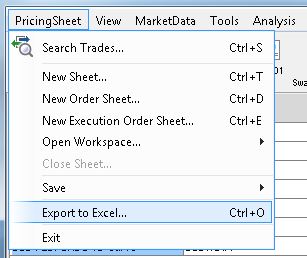
| » | You can enter a trade ID or a bundle ID in the "Trade/Bundle Id" field at the top of the pricing sheet, and the corresponding trade / bundle will be loaded in the pricing sheet. |
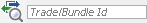
| » | Or you can click |
Open Trades window
Enter search criteria and click Find Trades or Find Bundles.
Then select the trades or bundles you want to load, and click Open Selected. The trades will be loaded in the pricing sheet.
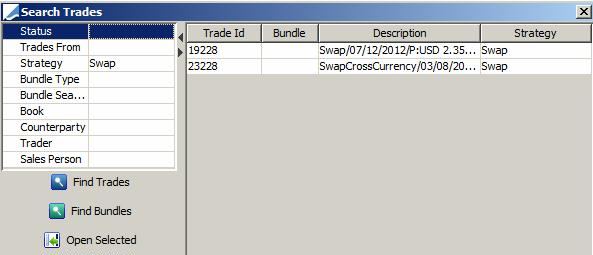
2.11 Exporting Trade Strategies to Excel
You can export strategies into an Excel file by either selecting the option in the PricingSheet menu or using a keyboard shortcut. This feature exports all strategies open in the active Pricing Sheet, launches the Excel file, and saves a copy of the file in the user's directory.
To export strategies in the active Pricing Sheet, select "Export to Excel" in the PricingSheet menu, or press Ctrl+O.
| » | The Excel file is opened and includes trade properties, pricer measures, and trade details. |
| » | A copy of the Excel file is also saved to the user's directory. |
| – | Click the File menu in Excel to see information about the file path where the file is saved. |
| – | Multiple exports are not overridden but saved individually in the directory. |
| – | Files are saved with the following file name format: |
PricingSheet_Table_TradeEntry_Sheet_1_yyyyMMDD_HHMMSS.xls (H=hour; M=minute; S=second)
3. Bid/Ask Volatility Pricing
The Pricing Sheet can be configured to enable bid/ask pricing with an option to display two-way output for pricing measures. Two-way output requires market data that provides information for both bid and ask quotes.
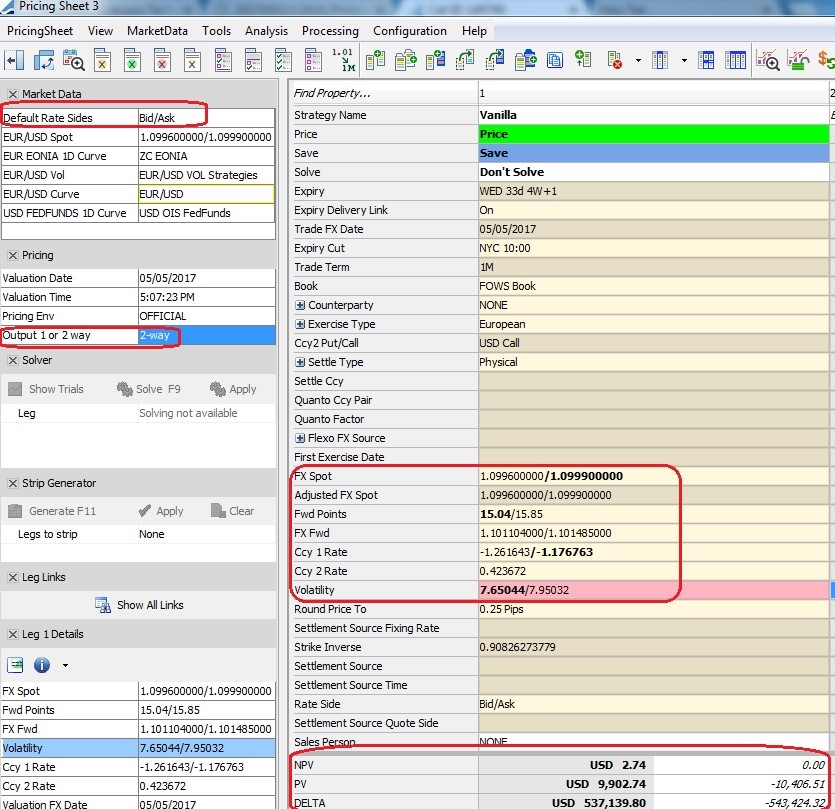
Example of Bid/Ask pricing for an FX Vanilla strategy
3.1 Settings
Bid/Ask pricing is specified on the Market Data tools panel for the "Default Rate Sides" property.
You can also apply bid/ask pricing to an individual leg by adding the "Rate Side" property to the strategy in the Pricing Sheet Profiles window.
Settings for Bid/Ask pricing are as follows:
| • | Choice - No spread is applied. |
| • | Closing Price - Pricing sheet uses the Close quote set and the volatility surface to price deals. |
| • | Bid/Ask - uses market data for spot, forwards, interest rates, and volatility. |
| • | Bid/Ask Vol - uses bid/ask market data for volatility. All other types use the Mid quote. |
| • | Bid/Ask Spot - uses bid/ask market data for spot. All other types use the Mid quote. |
| • | Bid/Ask Spot/Fwd - uses bid/ask market data for spot and forwards. All other types use the Mid quote. |
To select between one-way and two-way pricing output, use the "Output 1 or 2 way" setting in the Pricing panel.
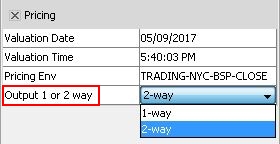
| • | 1-way - displays pricing from the mid quote. |
| • | 2-way - displays pricing using the bid and ask quote. |
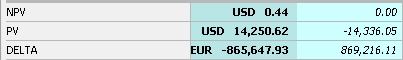
Sample output for two-way pricing
To make either of these settings the default setting, point to Configuration > User Preferences in the Pricing Sheet menu bar to open the Configure window. On the Defaults tab go to the Pricing settings, where you can configure the "Default Rate Sides" and "Default output pricing convention" settings according to preference.
3.2 Required Market Data
The following market data items are needed to fulfill requirements for the "Default Rate Sides" settings in the Pricing Sheet's Market Data panel when using Bid/Ask pricing.
Spot Quotes
Both bid and ask quotes are required in the Quotes window.
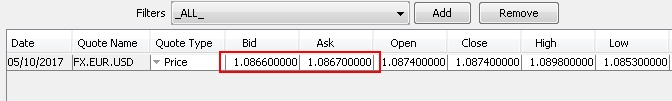
To open the Quotes window from the Pricing Sheet, point to MarketData > Quotes. Make sure Bid and Ask quotes are both populated.
For details on working in the Quotes window, see Quotes Window.
Forwards and Volatility
To check for bid/ask rates in curves and vol surfaces, you can open the Market Data Manager by pointing to Market Data > Display in Market Data Manager in the Pricing Sheet menu bar.
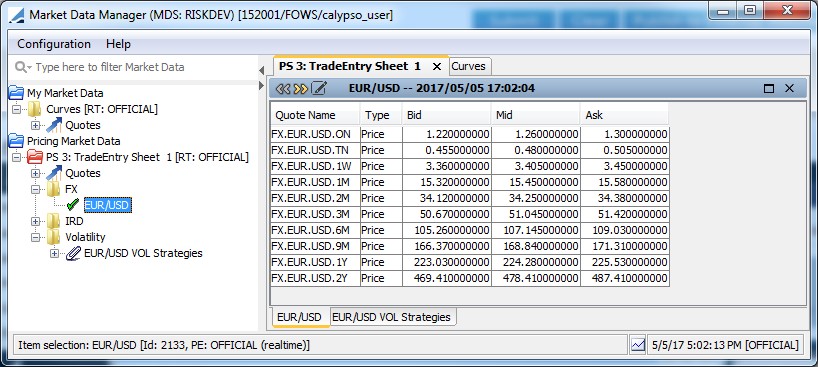
For details on working in the Market Data Manager, see Market Data Manager.
3.3 Recommendations for FX Options
| • | For most liquid vanilla options, up to 1 year, using Bid/Ask Vol will suffice for two-way pricing given Delta is exchanged with the counterparty at the inception. Otherwise, use Bid/Ask for all market data. |
| • | For longer tenor Options, use Bid/Ask for all market data (since Forward and Interest rates have a bigger impact on the pricing of long dated Options and substantial premium bid/ask spread will come from Forward/Interest rate bid/ask spread). |
| • | For exotics, use Bid/Ask for all market data. |
4. Using Workspaces
You can save all trade IDs currently in the Pricing Sheet as a workspace. Saving a workspace keeps the current view of the trades and their order. When you close and re-open the Pricing Sheet, you can open a saved workspace with all its trades in place.
| » | To save as a new workspace, click the down arrow next to the |
| » | To save /update an existing workspace, click the |
| » | To open a workspace, select PricingSheet > Open Workspace > Choose. |
Select the desired workspace and click OK.
Or you can select from a list of recently opened workspaces under PricingSheet > Open Workspace.
To clear the list, select PricingSheet > Clear Recent.
Saved workspaces are automatically added to the Trade Blotter as a blotter workspace.
See Trade Blotter for details.
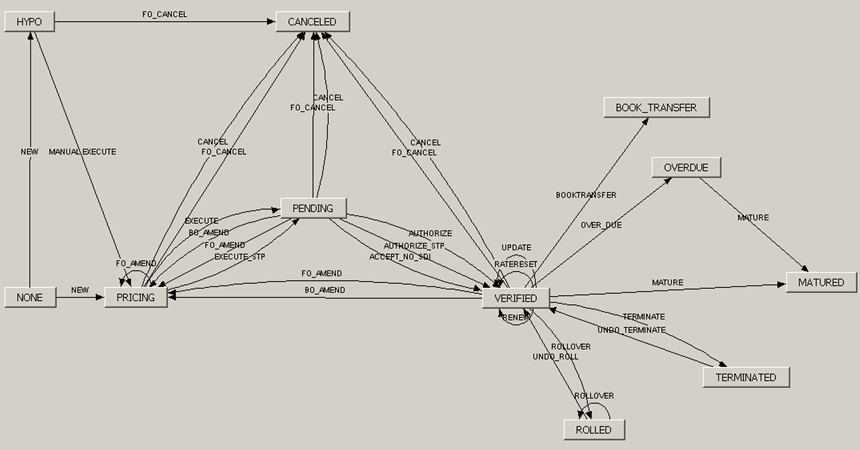
5. Applying Trade Lifecycle Actions
You can view upcoming lifecycle activity from the Calypso Navigator using Reports > Trade Diary.
Once a trade is saved and reaches a back office status, you can apply the following actions to the trade.
Select a trade, and choose one of the following from the Processing menu:
| • | Processing > Allocate - To allocate the trade to set of books or a set of legal entities - It brings up the Allocation window - Help is available from that window. |
| • | Processing > Exercise - To exercise the trade - It brings up the Exercise window - Help is available from that window. |
| • | Processing > Terminate - To terminate the trade - It brings up the Termination Action report - Help is available from that window. |
| • | Processing > Trigger - To exercise the trade - It brings up the Exercise window - Help is available from that window. |
Other trade lifecycle actions are applied as follows:
| • | You can reset floating rates from the Calypso Navigator using Trade Lifecycle > Reset > Rate Reset, or using the RATE_RESET scheduled task. |
| • | You can set the fixing between currencies from the Calypso Navigator using Trade Lifecycle > Reset > FX Rate Reset. |
| • | You can expire futures from the Calypso Navigator using Trade Lifecycle > Expiration & Exercise > Future Expiry or the FUTURE_POSITION_EXPIRY scheduled task. |
| • | You can exercise future options and ETO FX from the Calypso Navigator using Trade Lifecycle > Expiration & Exercise > Fut Opt / ETO Exercise. |
| • | You can compute margin calls on the clearing accounts for Futures and Future Options using the EOD_BROKER_STATEMENT scheduled task. |
6. Running Risk Analyses on-the-fly
You can run risk analyses on-the-fly on the strategies, using one of the following methods:
| • | Choose Analysis > On Demand Analysis, and select the Ad Hoc panel - Select the input parameters and the analysis parameters, and click Run. |
| • | Choose Analysis > On Demand Analysis, and select the On Demand panel - Select the input parameters and click a predefined analysis, and click Run. |
| • | Choose Analysis > On Demand Analysis Shortcuts, and select a risk speed button, provided you have defined risk speed buttons for the pricing sheet - Risk speed buttons can be defined using Analysis > On Demand Analysis Speed Buttons. |
The results will be displayed in the Calypso Workstation or saved to a file, based on the selected parameters.
See On Demand Analysis for complete details on using the On Demand Analysis window and defining risk speed buttons.
7. Using the Payoff Chart
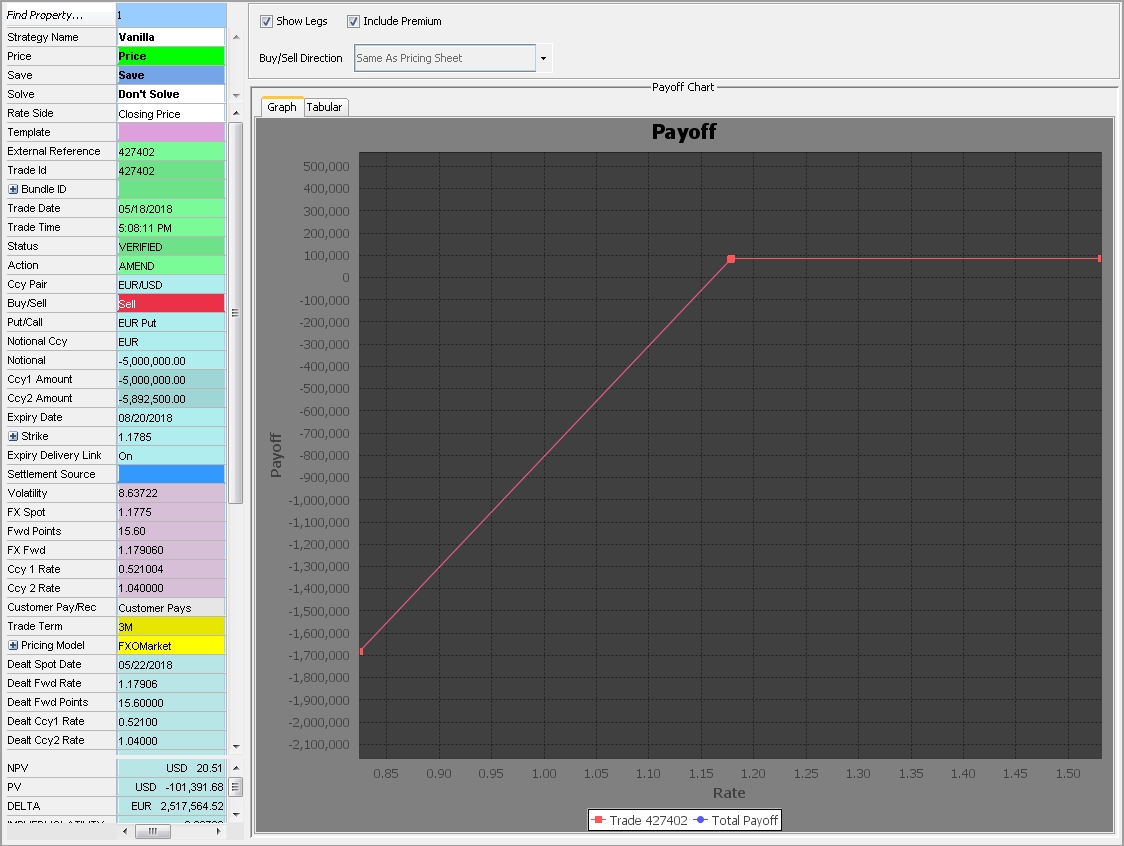
For FX Options trades - including vanilla and exotics - the Payoff Chart provides both a graphical and tabular representation of payoff based on the underlying. To open the chart, click  on the Toolbar. The chart is automatically populated with information from the leg or legs on the active pricing sheet.
Ⓘ [NOTE: Only the legs that are active for "Price" will be included in the Payoff Chart. Any legs with the Price property set to "Don't Price" will not be included in chart output.]
7.1 Chart Settings
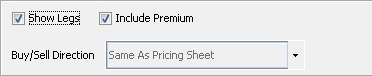
| » | Select the "Show Legs" checkbox to display legs separately when there are more than one. When the checkbox is cleared, the chart displays the Total Payoff. |
| » | Select the "Include Premium" checkbox to include the premium or fees in the chart output. |
| » | You can use the "Buy/Sell Direction" drop-down to determine whether the chart output is the same or the opposite direction of the Pricing Sheet. |
For details on making default settings for these options, see "Payoff Graph" under Defaults Panel in the Setting User Preferences documentation.
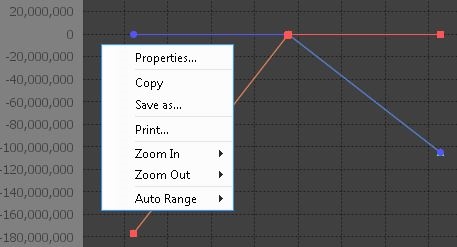
7.2 Graph Properties and Controls
| » | Right-click anywhere in the graph to open the properties and controls menu. |
| Menu item | Description |
|---|---|
|
Properties |
Select Properties to open the Chart Properties window where you can edit the chart's title, design how information is plotted on the chart's axes, and make other changes to appearance. |
| Copy / Save as... / Print |
Select Copy to copy the graph to the system clipboard, which then allows you to paste the image using standard keyboard or mouse controls. You can also save the graph as an image (.png file format) or print the graph by selecting Print, which opens the Page Setup then Print dialog box. |
| Zoom In / Zoom Out | You can zoom in or zoom out on the graph to see either more or less detail. This feature also allows you to zoom in or out by individual axis, thereby preserving the scale of the opposite axis. |
| Auto Range | Select Auto Range to stretch the scale so that the plot fills the entire range of the graph. You can stretch the plot points to the full range by individual axis as well. |
| » | You can manually zoom in and out using the scrolling wheel on your mouse device. |
| » | Hovering over the plot points displays a tooltip that includes the trade ID and specific values for both axes where the plot falls on the graph. |
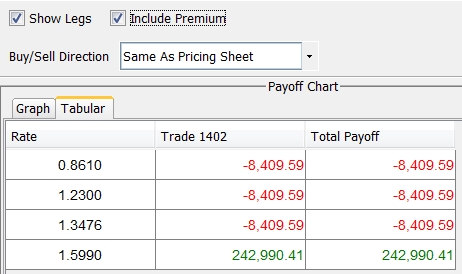
7.3 Tabular Display
Select the 'Tabular' tab to view the same output as the graph in a table format. The same chart settings apply, such as "Show Legs" and "Include Premium."
See also
| • | Out-of-the-box Strategies |
| • | Capturing Trades |
| • | Solving Functions |