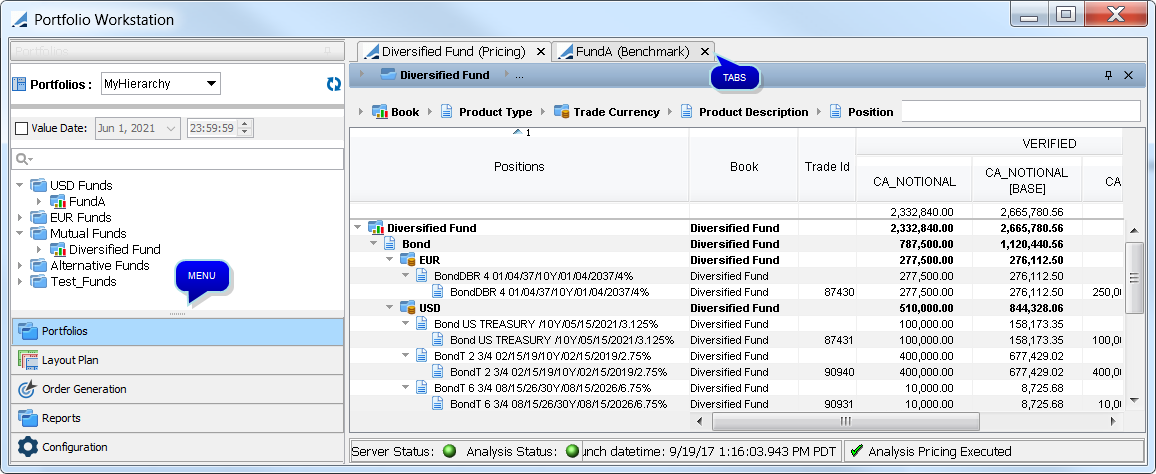
Portfolio Workstation
The Portfolio Workstation (PWS) allows viewing analyses for pre-configured portfolio hierarchies based on funds, mandates, strategies, and custom portfolios.
The Portfolio Workstation also allows viewing other Calypso reports, such as Back Office reports, for pre-configured report hierarchies.
Ⓘ [NOTE: As the functionality can vary between the two, in this document, "analysis" refers to analyses designed to be viewed in the Portfolio Workstation, such as the Investment Indicators analysis, while "report" refers to other Calypso reports, such as the Inventory Position report, which are only able to be displayed in the Portfolio Workstation using a Report To Risk analysis]
From the Calypso Navigator, navigate to Configuration > Asset Management > Portfolio Manager Workstation to bring up the Portfolio Workstation (menu action am.workstation.PortfolioManagerWorkstation).
1. Before You Begin
Access Permissions
The following access permission functions apply to the Portfolio Workstation. These values must be added to the domain function, then defined per User Group:
| • | PortfolioWorkstationConfig – Permission to access Portfolio Workstation. |
| • | PWSUnitViewConfig – Permission to access Units Configuration. |
| • | PWSUnitAddModifyRemoveConfig – Permission to make changes to Units Configuration. |
| • | PWSReportEngineConfigViewConfig – Permission to access Analysis Configuration. |
| • | PWSReportEngineConfigAddModifyRemoveConfig – Permission to make changes to Analysis Configuration. |
| • | PWSServerStatusConfigAddModifyRemove – Permission to use the Server Status buttons. |
| • | PWSDecimalsAddModifyRemoveConfig – Permission to make changes to (Decimal) Display Configuration. |
| • | PWSColumnViewConfig – Permission to access Columns Configuration. |
| • | PWSColumnAddModifyRemoveConfig – Permission to make changes to Columns Configuration. |
| • | PWSColumnFormulaViewConfig – Permission to access Column Formulae Configuration. |
| • | PWSColumnFormulaAddModifyRemoveConfig – Permission to make changes to Column Formulae Configuration. |
| • | PWSColumnSetViewConfig – Permission to access Column Sets Configuration. |
| • | PWSColumnSetAddModifyRemoveConfig – Permission to make changes to Column Sets Configuration. |
| • | PWSGroupingViewConfig – Permission to access Groupings Configuration. |
| • | PWSGroupingAddModifyRemoveConfig – Permission to make changes to Groupings Configuration. |
| • | PWSLayoutViewConfig – Permission to access Layouts Configuration. |
| • | PWSLayoutAddModifyRemoveConfig – Permission to make changes to Layouts Configuration. |
| • | PWSFormattingViewConfig – Permission to access Formatting in Layout Plans. |
| • | PWSFormattingAddModifyRemoveConfig – Permission to make changes to Formatting. |
| • | PWSWidgetViewConfig – Permission to access Widgets in Layout Plans. |
| • | PWSWidgetAddModifyRemoveConfig – Permission to make changes to Widgets. |
| • | PWSOrderWidgetTabAddModifyRemoveConfig – Permission to make changes to Orders widget tab templates. |
| • | PWSColoringAddModifyRemoveConfig - Permission to make changes to Colorings Configuration. |
Portfolio Hierarchy
Before using and configuring the Portfolio Workstation, you need to set up Portfolio Hierarchies.
 See Portfolio Hierarchy for details.
Timing Logs
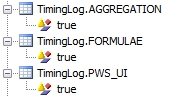
You can enable a timing log with the following timing categories:
| • | AGGREGATION – Check how much time aggregation is taking. |
| • | FORMULAE – Check how much time formula-based columns are taking to load. |
| • | PWS_UI – Check how much time is taken by changes in a Portfolio Workstation panel's states. |
To use the timing log, add each of the desired timing categories as a domain value TimingLog.<TimingCategory> (ex. TimingLog.PWS_UI) with value “true”. The timing logs will then be available in the Navigator log file.
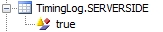
You can also add the log category “SERVERSIDE” to view timing logs in the Analysis Server.
2. Tour of the Portfolio Workstation
The Portfolio Workstation is highly customizable. You can drag and drop windows anywhere within the layout.
The Portfolio Workstation may show the following windows based on your selections:
| • | The menu to access the portfolios, layout plan, order generation, and configuration windows. |
| • | Analysis report tabs for the selected portfolios. |
| • | Layout Plan windows for errors, marks, quotes, currency adjustments, charts, liquidation, and orders. |
| • | Configuration windows for the report engines, the server status, the layouts, the groupings, the column sets, the columns, the column formulae, the units, the widgets, and the display. |
General Process
The general process for using the Portfolio Workstation is the following:
Step 1 – Configure Analysis Server, Units, Display, Columns, Column Formulae, Column Sets, Groupings, Widgets, and Layouts.
Step 2 – Select portfolios and layouts, and display analyses.
These steps are further described below.
3. Configuring the Portfolio Workstation
Before using the Portfolio Workstation, you must configure it using the Configuration windows.
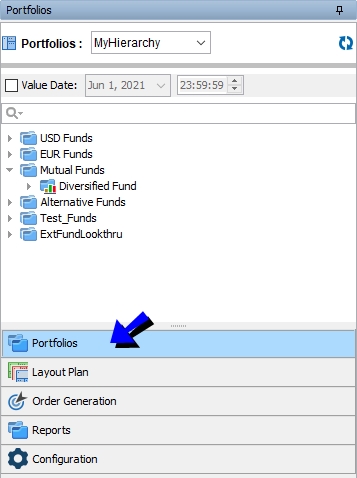
Select Configuration from the menu:
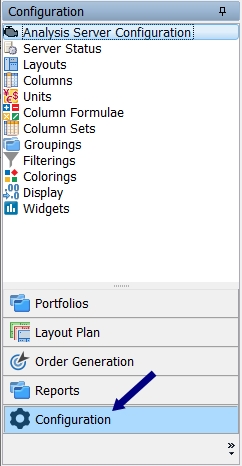
Then double-click the item you wish to configure - The configuration should be done in the following order:
| • | Analysis Server Configuration – This allows selecting which analyses you would like to run. This provides the list of available columns. |
| • | Server Status – This allows viewing the server status and the analyses that it is running. |
| • | Units – This allows creating units by currency or by percentage to customize the columns' units. |
| • | Display – This allows setting a global decimals default for all analyses. |
| • | Columns – This allows configuring the columns (alias, unit, etc). |
| • | Column Formulae – This allows defining custom columns. |
| • | Filterings – This allows defining filters which are comprised of formula columns. |
| • | Colorings – This allows defining conditional formatting. |
| • | Column Sets – For each analysis, this allows selecting which columns to display. |
| • | Groupings – This allows defining column groupings. |
| • | Widgets – This allows configuring additional windows. |
| • | Layouts – This allows defining layouts that combine column sets and groupings. |
3.1 Analysis Server Configuration
The Analysis Server Configuration window allows to search, filter and review the analyses to be displayed. You can filter by analysis type, name, analysis parameter, Pricing Environment, Trade Filter Template and Market server.
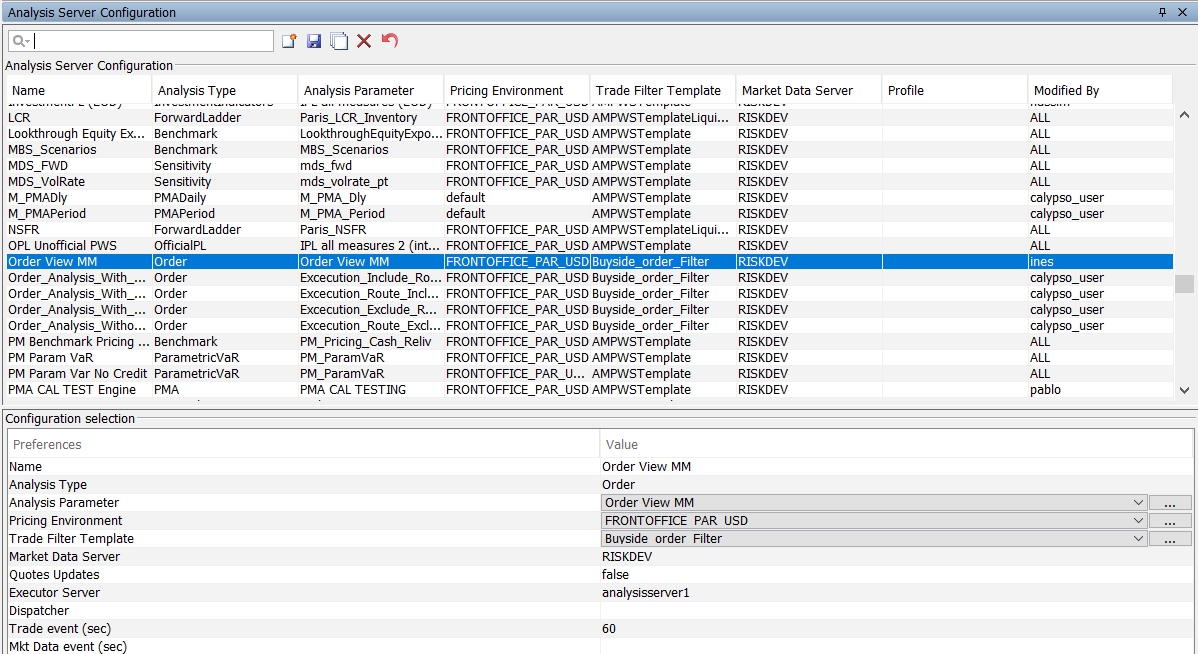
| » | The search option helps to filter the results based on the entry added in the search. |
| » | To filter, click |
| » | The details of the analysis is given as a list at the bottom. |
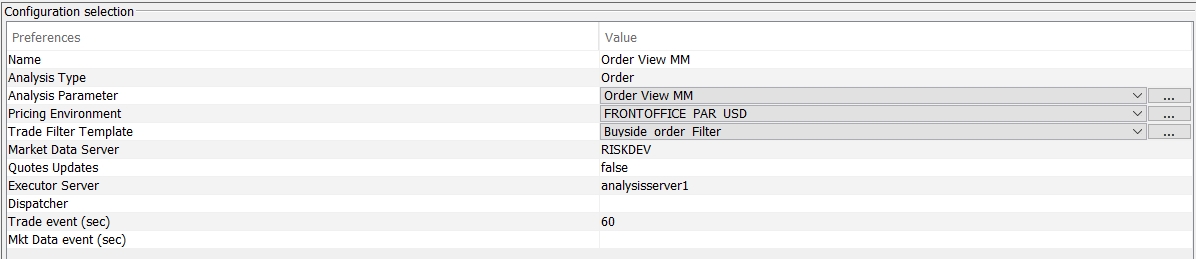
| » | To modify an existing configuration, select a configuration. |
Modify the fields as needed, they are described below. Then click ![]() to save your changes.
to save your changes.
| » | To create a new configuration, click |
Enter the fields described below as needed, then click ![]() .
.
| » | When you start the selected server, you can view its status and the analyses it is running in the Server Status window. |
See Server Status for details.
|
Fields |
Description |
||||||||||||||||||||||||||||||||||||||||||||||||||||||
|---|---|---|---|---|---|---|---|---|---|---|---|---|---|---|---|---|---|---|---|---|---|---|---|---|---|---|---|---|---|---|---|---|---|---|---|---|---|---|---|---|---|---|---|---|---|---|---|---|---|---|---|---|---|---|---|
|
Analysis Type Analysis Parameter |
Select the type of analysis and its parameters:
|
||||||||||||||||||||||||||||||||||||||||||||||||||||||
|
Pricing Environment |
Select the pricing environment to price the trades and positions. |
||||||||||||||||||||||||||||||||||||||||||||||||||||||
|
Trade Filter Template |
Select a trade filter to be used as a template for the position spec. The trades and positions are loaded based on the criteria of the portfolio hierarchy, and this trade filter is only used to define the position spec. Ⓘ [NOTE: This trade filter can only contain a position spec] |
||||||||||||||||||||||||||||||||||||||||||||||||||||||
|
Market Data Server |
Select the Market Data Server to receive the market data in real-time. |
||||||||||||||||||||||||||||||||||||||||||||||||||||||
|
Profile |
Defines the group of user should be added in the analysis and it reflects the access right given to the group defined. |
||||||||||||||||||||||||||||||||||||||||||||||||||||||
|
Load Balance Policy |
Select the Load Balance Policy:
Fast products are the product types defined in domain expressProductTypes, usually product types priced from quotes. |
||||||||||||||||||||||||||||||||||||||||||||||||||||||
|
Cache Quotes Updates |
Check to cache quotes updates. |
||||||||||||||||||||||||||||||||||||||||||||||||||||||
|
Executor Server |
For the load balance policy "None", select one server. For the load balance policy "ExpressProduct", select Server 1 and another server. You can start the servers using You can click ... to add more servers. Please refer to Calypso Web Admin documentation for complete details on adding servers.
|
||||||||||||||||||||||||||||||||||||||||||||||||||||||
|
Dispatcher |
Select a dispatcher configuration as needed to distribute the processes.
|
||||||||||||||||||||||||||||||||||||||||||||||||||||||
|
Trade event (sec) |
|
||||||||||||||||||||||||||||||||||||||||||||||||||||||
|
Mkt Data event (sec) |
|
Deploying Multiple Analysis Servers
When using multiple Analysis Servers on different machines, all of the Analysis Servers for the same environment should be run using the same Hazelcast cluster.
Modify the hazelcast.xml file and make sure that the modification is deployed on each Analysis Server. For example:
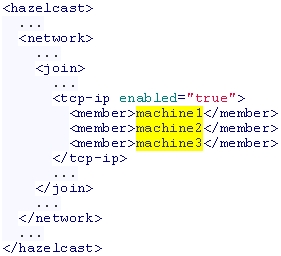
You can provide IP addresses or hostnames for member elements. You can also give a range of IP addresses. For example: 192.168.1.0-7
One way to verify that the configuration is correctly applied is to check the server.log of each Analysis Server. For example:
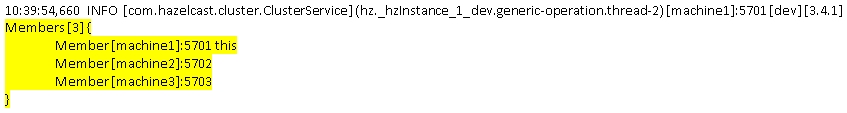
Please refer to "Discovering Members by TCP" in Hazelcast's documentation for more details on Hazelcast configuration if needed.
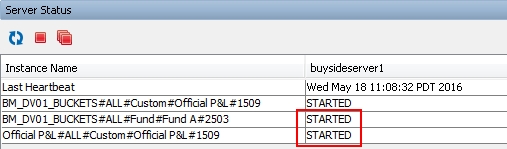
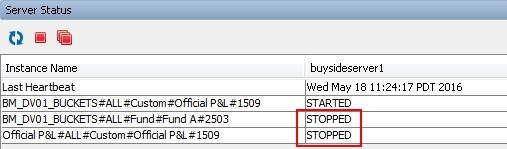
3.2 Server Status
The Server Status window allows viewing the server status and the analyses that it is running.
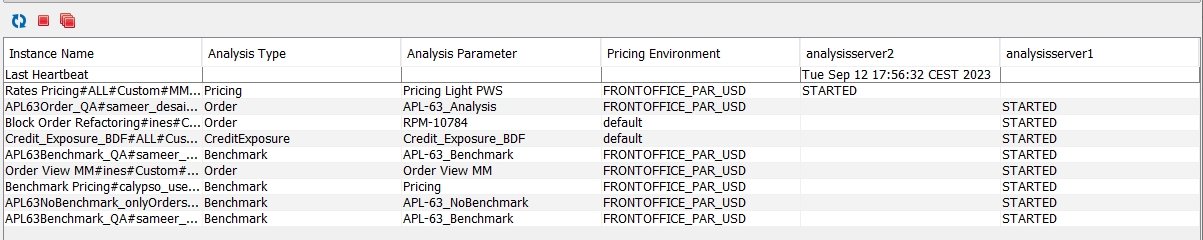
Ⓘ [NOTE: If the same Analysis Server is used by both the Portfolio Workstation and the Compliance Analyzer, all analyses that are being run by either are displayed]
| » | You can select an analysis and click |
Additionally, you can view metrics for the analyses that are running in the Portfolio Manager Analyses Monitoring window.
See Portfolio Manager Analyses Monitoring for details.
3.3 Units
By default, units are expressed in local currency. The Units window allows the creation of units by currency or by percentage to customize the columns' units.
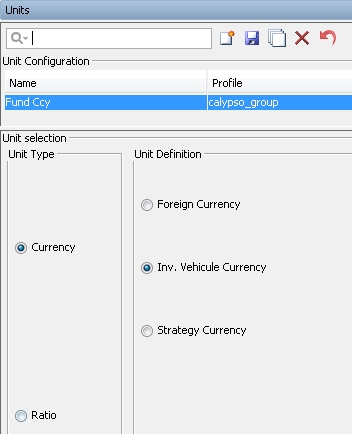
| » | Click |
| » | In the "Unit selection" area, select the unit type: |
| – | Currency: Select the reference currency. |
| – | Ratio: Select the level of reference, and select the reference amount. |
Level – None, Entry Point, Investment Vehicle, or Strategy.
Multiplier – Enter a multiplier as needed (e.g., 0.001, 100, 10000, etc.).
Hierarchy – Select to compute the percentage of the column within the hierarchy.
Column – Select to compute the percentage of the column with respect to another column - Select the reference column in that case.
Time Offset and Strategy Allocation are not currently applicable.
| » | Click |
You can select units in the Columns configuration.
3.4 Display
The Display window allows setting globally the number of decimals to be displayed in all analyses.
Global Decimals Display is not used. Instead, you can use the override decimal at layout level.
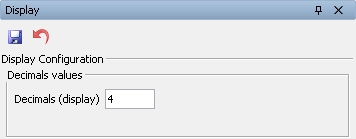
| » | Enter the number of decimals to be displayed. If not set, the default is 2. |
| » | Click |
3.5 Columns
The Columns window allows configuring the columns.
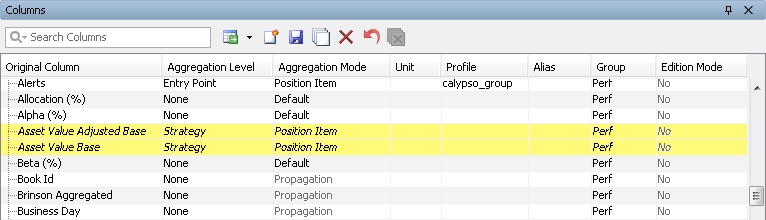
| » | Click |
Columns that appear with a yellow background have not been saved yet. They need to be saved in order to be available in the Column Sets configuration.
For each column, you can configure the fields described below.
You can also configure Rating Equivalent columns, and Classification columns.
See Rating Equivalents for setup details.
See Classifications for setup details.
| » | You can click |
If a row is selected when the button is clicked, the Aggregation Level, Aggregation Mode, and Group columns will be copied to the new row.
Enter the column name and complete the other fields as needed. Note that the column name entered must match exactly the expected column name from the analysis parameter.
| » | Click |
|
Fields |
Description |
||||||||||||||||||||||||
|---|---|---|---|---|---|---|---|---|---|---|---|---|---|---|---|---|---|---|---|---|---|---|---|---|---|
|
Original Column |
Displays the name of the column, as selected in the parameters of the analysis. |
||||||||||||||||||||||||
|
Aggregation Level |
Select the aggregation level:
|
||||||||||||||||||||||||
|
Select the aggregation mode as needed:
|
|||||||||||||||||||||||||
|
Unit |
Select a unit as needed. Units are created in the Units window. |
||||||||||||||||||||||||
|
Profile |
Select a user group as needed to restrict the display of the column by user group. |
||||||||||||||||||||||||
|
Alias |
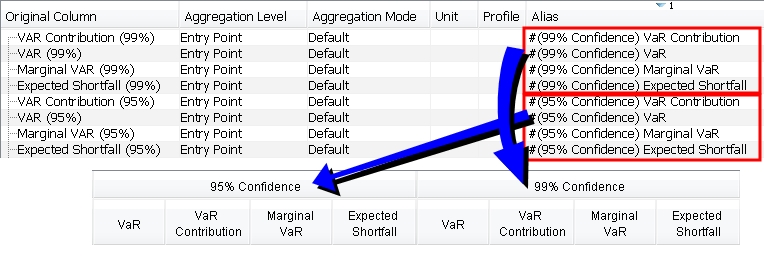
Enter a display name as needed. Grouping columns by alias You can prepend column aliases with "#(<prefix>)" and those columns with the same prefix will be grouped together in the results display. In the Column Sets window, you need only add them to the Main Columns area, and not the Pivot Columns or Grouped Columns areas.
|
||||||||||||||||||||||||
|
Group |
Displays the analysis for which this column is available. |
||||||||||||||||||||||||
|
Edition Mode |
Displays the edition mode of the column:
|
3.6 Column Formulae
The Column Formulae window allows defining custom columns.
Formula columns created in the Limits & Compliance application are also displayed here.
Please refer to Calypso Limits & Compliance documentation for details on the Limits & Compliance module.
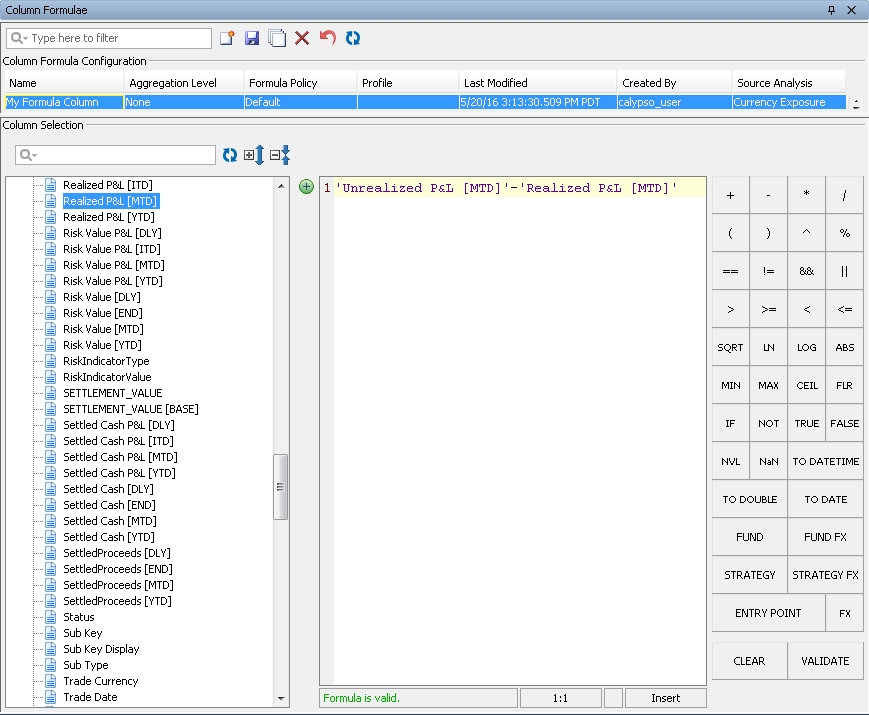
The available operators are shown on the right-hand side. The format of a custom column is 'column'operator'column', 'column' can also be a constant.
| » | Click |
Select an aggregation level as needed: Entry Point, Fund, Strategy, Currency, Product Description, Internal Fund, Internal Fund Strategy, or None. These aggregation levels work the same as for regular columns.
Select a formula policy to define how to apply the formula:
| – | Default: Formula column will be evaluated for position nodes only. Position nodes values will then be aggregated (summed) as usual for grouping nodes. |
| – | Position Item: Behaves in a similar way as Default. In case multiple position items per trade/positions are part of the analysis output (e.g., Sensitivity Analysis, Simulation Analysis, Multi-Simulation Analysis, etc.), each one will contribute to the aggregation once (e.g., aggregate each sensitivity per risk factor). On the contrary, for Default mode, only one position item value will impact aggregation (e.g., NPV [Base] pricer measure, no need to to aggregate it once per risk factor). |
| – | Position Item Formula: Behaves the same as Default, except for Product Description grouping node values - instead of being calculated as the result of the aggregation of its child nodes, the formula column will be evaluated the same way as positions. |
| – | Propagation: Formula column will be evaluated for position nodes only. For a given node, if all its child nodes have the same value then that value will be set to it. |
| – | Grouping Evaluation: Formula column will be evaluated for grouping nodes only - there is no aggregation or propagation for grouping nodes. For grouping nodes, this formula policy is equivalent to Full Evaluation. Position nodes formula column evaluation will be skipped. |
| – | Full Evaluation: Formula column will be evaluated for all nodes (position nodes and grouping nodes) - there is no aggregation or propagation for grouping nodes. For grouping nodes, this formula policy is equivalent to Grouping Evaluation. |
| – | Gross: Sum everything at the grouping criteria level and if the result is negative, take the absolute value. |
| – | Negative Gross: Sum all negative values and return the absolute value. |
| – | Positive Gross: Sum all positive values and return the sum. |
| – | Negative Gross All: Sum all values and return the absolute value if negative, else 0. |
| – | Positive Gross All: Sum all values and return the sum if positive, else 0. |
| – | Max: Take the highest value. |
| – | Min: Take the lowest value. |
| – | Average: Take the average of all values. |
| » | Enter the formula. You can drag and drop columns, or you can select a column and click |
Valid examples are shown below:
| – | 'Time Effect'+'Market Data Effect'
|
| – | ABS('Time Effect')
|
| – | 2*'Time Effect'
|
| – | 100*'Market Value Change (Base)'/FUND.'MV_BASE'
|
See the sections below for the available operators and functions.
You can also use the syntax FUND.'column' or STRATEGY.'column' to get the aggregate value at the fund or strategy level. See the last example above.
You can use SWITCH operators in the formula if desired - see SWITCH Operator for details.
| » | Click VALIDATE to check the validity and syntax of your formula. |
| » | Click |
The formula column can now be displayed in the results. It is not available for sorting or filtering.
| » | You can click |
| » | You can click CLEAR to clear the formula editor. Note that it also detaches the Source Analysis from a formula column. |
Ⓘ [NOTE: Only formulas with expression up to 3900 characters are supported – If a longer formula is needed, then you will need to split it into multiple sub-formulas]
Environment Property
The following environment property is optional and only applicable to the Portfolio Workstation.
| • | PWS_PERF_POOL_SIZE – The maximum number of threads that can be used in calculating the formula columns in the Portfolio Workstation. Default is 50. |
Basic Operators
| • | + – Addition |
| • | - – Subtraction |
| • | * – Multiplication |
| • | / – Division |
| • | % – Modulus |
| • | == – Equal to |
| • | != – Not equal to |
| • | < – Less than |
| • | <= – Less than or equal to |
| • | > – Greater than |
| • | >= – Greater than or equal to |
| • | && – And |
| • | || – Or |
Ⓘ [NOTE: When using whole numbers in formulas, you need to add ".0", for example: 'NOTIONAL'/10000.0]
Boolean Functions
The following operators and functions are valid for Boolean expression:
| • | == |
| • | != |
| • | NVL – Null value. Returns argument 1 if not null, else returns argument 2. If the two arguments are double, return argument 1 if not null, not NaN and not infinite, else return argument 2. |
| • | VALIDNUMBER – Returns true if not NaN or +/- infinity. |
Example: VALIDNUMBER('Asset Value')
| • | ISZERO – Returns true if value is zero or close to zero (1e-10). |
Example: ISZERO('Asset Value')
| • | ISPOSITION – Returns true if the node being evaluated is a position. |
| • | ISGROUPING – Returns true if the node being evaluated is a grouping level node. |
| • | ISENTRYPOINT – Returns true if the node being evaluated is the consolidation node. |
| • | ISINTRADEFILTER – Returns true if the trade id is included in a given trade filter. It uses the syntax ISINTRADEFILTER('Trade Id',”<trade filter name>”) where 'Trade Id' is a column providing the trade id to test, and "<trade filter name>" is a string containing the trade filter name. |
Example: ISINTRADEFILTER('Trade Id',"MyTradeFilter"
Date and Datetime Functions
The following operators and functions are valid for date and datetime expression:
| • | == |
| • | != |
| • | < |
| • | <= |
| • | > |
| • | >= |
| • | NVL |
| • | MIN – Returns the smaller of the two arguments. |
| • | MAX – Returns the larger of the two arguments. |
| • | NOW – Returns a datetime value for the moment the formula is being evaluated. |
| • | TODAY – Returns a date value for the moment the formula is being evaluated. |
| • | TODATE – Converts a string into a date. See "Datetime String Format" below for details on the proper format. |
| • | TODATETIME – Converts a string into a date and time. See "Datetime String Format" below for details on the proper format. |
| • | DATE – Returns a date given a year, month and day. |
| • | VALDATE – Returns the underlying analysis valuation date. |
| • | DAYS – Returns the number of days between two dates (first two arguments), using the given base (optional third argument). |
Example: DAYS('Trade Date', 'Maturity Date', "30/360")
| • | YEARS – Returns the number of years between two dates (first two arguments), using the given base (third argument). |
Example: YEARS('Trade Date', 'Maturity Date', "30/360")
| • | BUSDAYS – Returns the number of business days between two dates using the given holiday calendar. |
Example: BUSDAYS('Trade date', 'Maturity date', "NYC")
| • | MONTH – Converts a date to a month. |
| • | YEAR – Converts a date to a year. |
| • | ADDDAYS – Returns the date that is the indicated number of days before or after the given date. |
Example: ADDDAYS('Maturity date', -1)
| • | ADDMONTHS – Returns the date that is the indicated number of months before or after the given date. |
Example: ADDMONTHS('Maturity date', -1)
| • | ADDYEARS – Returns the date that is the indicated number of years before or after the given date. |
Example: ADDYEARS('Maturity date', -1)
| • | ADDBUSDAYS – Returns the date that is the indicated number of business days before or after the given date using the given holiday calendar. |
Example: ADDBUSDAYS('Maturity date' , 1, "PAR")
Datetime String Format
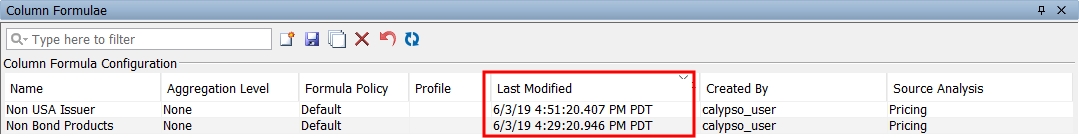
The TODATE and TODATETIME functions take a string as input. This string must be in specific format for the conversion to date or datetime work. This format depends on the datetime format setting of your computer. You can use the Last Modified column's timestamps as a reference for the correct format for your system.
Math Functions
| • | LOG (LN button) – Returns the natural logarithm (base e) of a numerical value. |
| • | LOG10 (LOG button) – Returns the base 10 logarithm of a numerical value. |
| • | FLOOR (FLR button) – Returns the largest (closest to positive infinity) integer value that is less or equal to the argument. For example, FLOOR (2.8) is 2, because here 2 is the largest integer but less than 2.8, i.e., 2<=2.8 |
| • | CEIL – Ceiling. Returns the smallest (closest to negative infinity) integer value that is greater than or equal to the argument. For example, CEIL(2.8) is 3, because here 3 is the smallest integer but greater than 2.8, i.e., 3>=2.8 |
| • | ABS – Returns the absolute value of a numerical value. |
| • | SQRT – Returns the correctly rounded positive square root of a numerical value. |
| • | ROUND – Returns a number rounded to a given number of decimals, rounded up or down to the nearest number. Only right of decimal rounding is supported. |
| • | ROUNDUP – Returns a number rounded to a given number of decimals, where it is always rounded up to the next number. Only right of decimal rounding is supported. |
| • | ROUNDDOWN – Returns a number rounded to a given number of decimals, where it is always rounded down to the next number. Only right of decimal rounding is supported. |
| • | TRUNCATE – Returns a number truncated to a given number of decimals. A column truncated with this function will override the Portfolio Workstation global decimal settings set in the Display window. |
Ⓘ [NOTE: Default aggregation mode is not impacted by any ROUND, ROUNDUP, ROUNDDOWN, or TRUNCATE function. Aggregation takes places as usual, and no function is applied on top of the sum operation. Aggregates will be displayed with the same scale as specified by the formula-based column precision]
Text Functions
| • | LEFT – Returns the leftmost characters from a text value. |
| • | RIGHT – Returns the rightmost characters from a text value. |
| • | LEN – Returns the number of characters in a text string. |
| • | CLEAN – Removes all non-printable characters from text. |
| • | EXACT – Checks to see if two text values are identical. |
| • | LOWER – Converts text to lowercase. |
| • | UPPER – Converts text to uppercase. |
| • | SEARCH – Finds one text value within another (not case-sensitive). |
| • | TOTEXT – Formats a number and converts it to text. |
| • | TODOUBLE – Converts a text argument into a double. |
Ⓘ [NOTE: "CONCAT" is not supported. Use "+" instead]
FX Functions
| • | FX – Returns the currency pair FX rate, given a base currency and a quote currency. |
Example: FX("EUR", "USD") or FX('Product Currency', "GBP") or FX('Product Currency', 'Trade Currency')
| • | FUNDFX – Returns the FX rate for the currency pair currency / fund currency. |
Example: FUNDFX("GBP")
| • | STRATEGYFX – Returns the FX rate for the currency pair currency / strategy currency. |
Example: STRATEGYFX("GBP")
Time Bucket Functions
Ⓘ [NOTE: As of version 17 July MR, if the Gateway API is disabled (environment property USE_GATEWAY=false), Time Bucket functions ONLY work when ersComplianceServer is started]
| • | TIMEBUCKET – Returns the time bucket associated with the given d.ate parameter. It is used when choosing a grouping based on a bucket template for analyses other than Credit Exposure (currently, only Benchmark, Forward Ladder and Pricing analyses are supported). It takes the following arguments: |
| – | Bucket template name. String constant. |
| – | Russian Doll parameter. Possible values are “NRD” for No Russian Doll, “RD” for Russian Doll, or “RRD” for Reverse Russian Doll. |
| – | Date parameter. It can be any date column of the analysis. |
| – | Holiday parameter. It can be a holiday expression, string, or "NONE". |
| – | Custom start date parameter. It can be used to select a start date that replaces the valuation date in the calculations. |
Example: TIMEBUCKET(“Simple”, “NRD”, 'Maturity Date', 'CounterParty.Holidays', TODATE('Instrument Start Date'))
| • | EXPOSUREBUCKET – Returns the time bucket for an exposure. It is used when choosing a grouping based on a bucket template, and only for the Credit Exposure analysis. It takes the following arguments: |
| – | Bucket template name. String constant. |
| – | Russian Doll parameter. Possible values are “NRD” for No Russian Doll, “RD” for Russian Doll, or “RRD” for Reverse Russian Doll. |
| – | 'Currency' column. String. |
| – | 'Currency2' column. String. Can be empty. Used if there is a second currency on certain product types. |
| – | '<measure>_startDate' column. The start date type used for a given measure is defined in the START_DATE_TYPE column of the ERS_CREDIT_MEASURE_CONFIG table. |
| – | '<measure>_endDate' column. The end date type used for a given measure is defined in the END_DATE_TYPE column of the ERS_CREDIT_MEASURE_CONFIG table. |
Example: EXPOSUREBUCKET(“Simple”, “NRD”, 'Currency', 'Currency2', 'MTM AddOn_startDate', 'MTM AddOn_endDate')
| • | TOTIMEBUCKET – Converts the argument to a time bucket value. Time bucket values can be compared using the operators <, <=, >, >=, ==, and !=. It takes the following arguments: |
| – | String for the time bucket. |
| – | Bucket template name. String constant. |
| – | Russian Doll parameter. Possible values are “NRD” for No Russian Doll, “RD” for Russian Doll, or “RRD” for Reverse Russian Doll. |
Example: TOTIMEBUCKET("0D-1Y", "Simple", "NRD")
| • | TIMEBUCKETSTART – Returns the start date of a time bucket. |
Example: TIMEBUCKETSTART('Time Bucket.5Y-10Y.NRD.Notional')
| • | TIMEBUCKETEND – Returns the end date of a time bucket. |
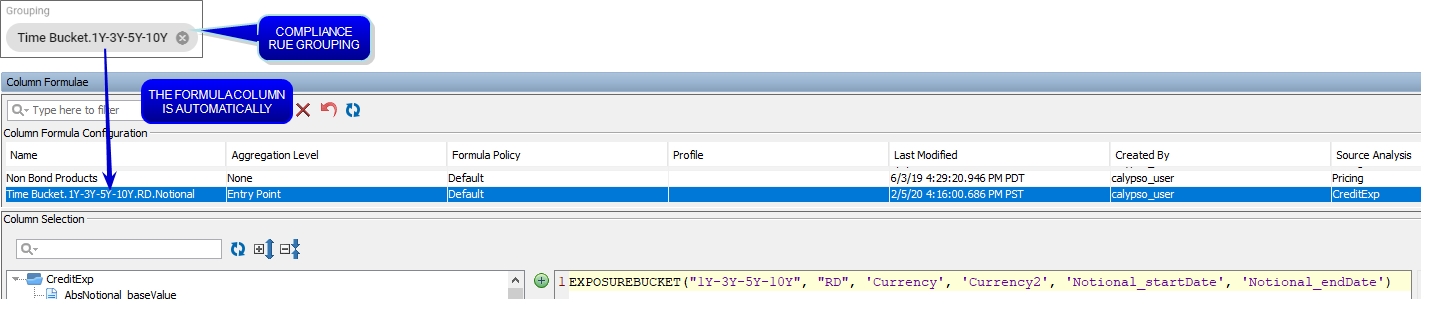
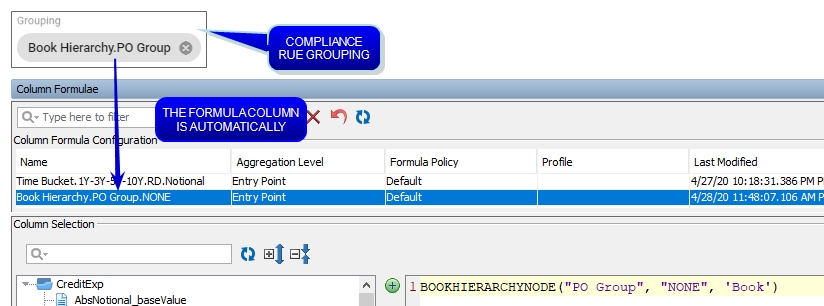
When a time bucket is used as a grouping in a Limits & Compliance rule, once the rule is saved and enabled, a formula column is automatically created for it. This generated formula column will also be displayed in the Portfolio Workstation Column Formulae window (you may need to click ![]() to see it), and it allows displaying the time buckets as columns and groupings in the Portfolio Workstation.
to see it), and it allows displaying the time buckets as columns and groupings in the Portfolio Workstation.
Please refer to Calypso Limits & Compliance documentation for details on the Credit Exposure analysis, and on using maturity time buckets.
Hierarchy Functions
| • | BOOKHIERARCHYNODE – Returns the book hierarchy leaf node when the max depth parameter is set to "NONE". (The behavior is different if the max depth parameter is set to an integer, but this is only useful for Limits & Compliance checks.) It takes the following arguments: |
| – | Name of the book hierarchy. String constant. |
| – | Maximum depth in the book hierarchy. "NONE" or an integer written as a string. |
Use "NONE" unless you intend to use the formula column as a Limits & Compliance rule grouping, in which case please refer to "Book Hierarchy" in Calypso Limits & Compliance documentation to determine whether to use "NONE" or an integer corresponding to a hierarchy level depth.
| – | 'Book' column or its alias. String. |
Example: BOOKHIERARCHYNODE("MyHierarchy", "NONE", 'Book') or BOOKHIERARCHYNODE("MyHierarchy", "3", '<Book Alias>')
Ⓘ [NOTE: To use the book hierarchy columns, the 'Book' column must exist in the reference analysis]
| • | HIERARCHYLEGALENTITY – Returns the legal entity of the role specified in the second parameter when the max depth parameter is set to "NONE". (The behavior is different if the max depth parameter is set to an integer, but this is only useful for Limits & Compliance checks.) It takes the following arguments: |
| – | Maximum depth in the legal entity hierarchy. "NONE" or an integer written as a string. |
Use "NONE" unless you intend to use the formula column as a Limits & Compliance rule grouping, in which case please refer to "Legal Entity Hierarchy" in Calypso Limits & Compliance documentation to determine whether to use "NONE" or an integer corresponding to a hierarchy level depth.
| – | A role column, i.e. 'Issuer', or its alias. String. |
Example: HIERARCHYLEGALENTITY("NONE", 'Issuer') or HIERARCHYLEGALENTITY("4", 'CounterParty.Short Name')
Ⓘ [NOTE: To use the legal entity hierarchy columns, the 'Issuer' and 'CounterParty.Short Name' columns must exist in the reference analysis]
When a book hierarchy or legal entity hierarchy is used as a grouping in a Limits & Compliance rule, once the rule is saved and enabled, a formula column is automatically created for it. This generated formula column will also be displayed in the Portfolio Workstation Column Formulae window (you may need to click ![]() to see it), and it allows displaying the book hierarchy/ legal entity hierarchy as columns and groupings in the Portfolio Workstation.
to see it), and it allows displaying the book hierarchy/ legal entity hierarchy as columns and groupings in the Portfolio Workstation.
Please refer to Calypso Limits & Compliance documentation for more details on the book hierarchy and legal entity hierarchy functions.
Other Functions
| • | CONSOLIDATION – Aggregates by columns A and B, using the syntax CONSOLIDATION(A,B). Column A must be numeric or an integer. Column B must be neither numeric nor an integer. |
Example: CONSOLIDATION('Asset Value [END]','Product Type')
In this example, if the 'Product Type' of the current line in aggregation is "Equity", then CONSOLIDATION('Asset Value [END]','Product Type') will return the sum of 'Asset Value [END]' of all positions whose 'Product Type' is "Equity".
| • | TOINTEGER – Converts the argument into an integer. Accepted arguments are a double, a column which returns a double, or a string formatting an integer. |
Example: TOINTEGER("123") or TOINTEGER('P&L (Base) [IDT]')
| • | COUNTRYHOLIDAYS – Returns the holidays corresponding to the given country. |
Example: COUNTRYHOLIDAYS('CounterParty.Country') or COUNTRYHOLIDAYS('UNITED STATES')
| • | CURRENCYHOLIDAYS – Returns the holidays corresponding to the given currency. |
Example: CURRENCYHOLIDAYS('Currency') or CURRENCYHOLIDAYS("EUR")
| • | LOOKUP – Returns a specific value using a filter. It takes the following arguments: |
| – | Target column. Must be of type numerical value. Can be an alias or not. |
| – | Filter column. Must be of the same type as the third parameter. |
| – | Accepted filter value column. Must be of the same type as the second parameter. |
Example: LOOKUP('Asset Value Base', 'Record Date, 'Trade Date')
| • | OWNRATIO – Fund ownership ratio as defined on the Ownership Ratios panel in the Fund Configuration window. |
Example: OWNRATIO('FundID',"OPTION_X")*100
| • | PREVIOUS – Allows computing indicators in a time series manner. It can be used in three ways: |
| – | PREVIOUS with no parameter: The column defined using PREVIOUS() must contain other columns of type Numeric. |
This function recursively (Top Down approach) tries to compute the desired column until it arrives at the first day of the period T0 and returns 0. At time T0, as the PREVIOUS() method returns 0, the Cumulative return will be equal to the Return. Then it use the Bottom Up approach to compute the rest; it will then go to T1 and compute [1+Return(T1)]*[1+Return(T0)]-1...
Example: (1 + 'Return (%)'/100.0) * (1 + PREVIOUS()) -1
| – | PREVIOUS with a numerical value: Parameter must be a numerical value. |
Using PREVIOUS with no parameter returns 0 by default at the first day of the period. This limits the way the PREVIOUS recursive function can be used, because sometimes it is required to return another value at the first day of the period. For example, to compute the maximum cumulative return of a period, you need to compare the cumulative return of a position at time T with the previous maximum cumulative return that was computed at T-1. It can only be computed by comparing the cumulative return of the first Day (time T0) with Minus Infinity, so that it returns the cumulative return of the first day.
Example: MAX('Cumulative Return', PREVIOUS(MinusInfinity))
| – | PREVIOUS with one expression parameter: Parameter must be of type Numeric or Date Expression. |
For other indicators, some values must be retrieved at time T-1. You can do this by providing the PREVIOUS function with one parameter which is a column of type Numeric that you want to retrieve for T-1.
Example: PREVIOUS() + (1 + PREVIOUS('Consolidated Cumulative Return')) * 'Contribution (%)'/100.0
| • | MAAR – Returns the Minimum Acceptable Rate of Return as specified in the PMA Period analysis configuration. No input parameters are needed. |
See PMA Analysis for details on PMA Period analysis.
| • | GETYEARNORMALIZATIONBASE – Returns the number of days, based on the Day Count specified in the PMA Period analysis configuration, for normalization. No input parameters are needed. |
See PMA Analysis for details on PMA Period analysis.
| • | FILTERSETNAME – Retrieves the name of the active filtering set for any PWS analysis. The output is a string. |
Example: 'Fund.Short Name' + TOTEXT(" FILTER IS ") + TOTEXT(FILTERSETNAME())
| • | GROUPINGCOUNT – Counts the number of positions under the same grouping. If used with the Full Evaluation mode, it returns in a grouping the total number of groupings that are shared under the same grouping. |
The SWITCH operator is an alternative to embedded IFs that can make complex conditional behavior. It has the following constraints:
| • | Duplicate case values are not allowed. |
| • | The value for a case must be the same data type as the variable in the SWITCH. |
| • | The value for a case must be a constant or a literal. Variables are not allowed. |
| • | The DEFAULT statement is mandatory, and must be defined as the last case within the SWITCH statement. |
| • | A SWITCH can be nested as a statement of another SWITCH. |
Syntax
In the Portfolio Workstation, the syntax for the SWITCH operator is as follows:
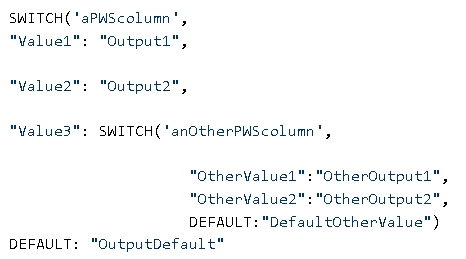
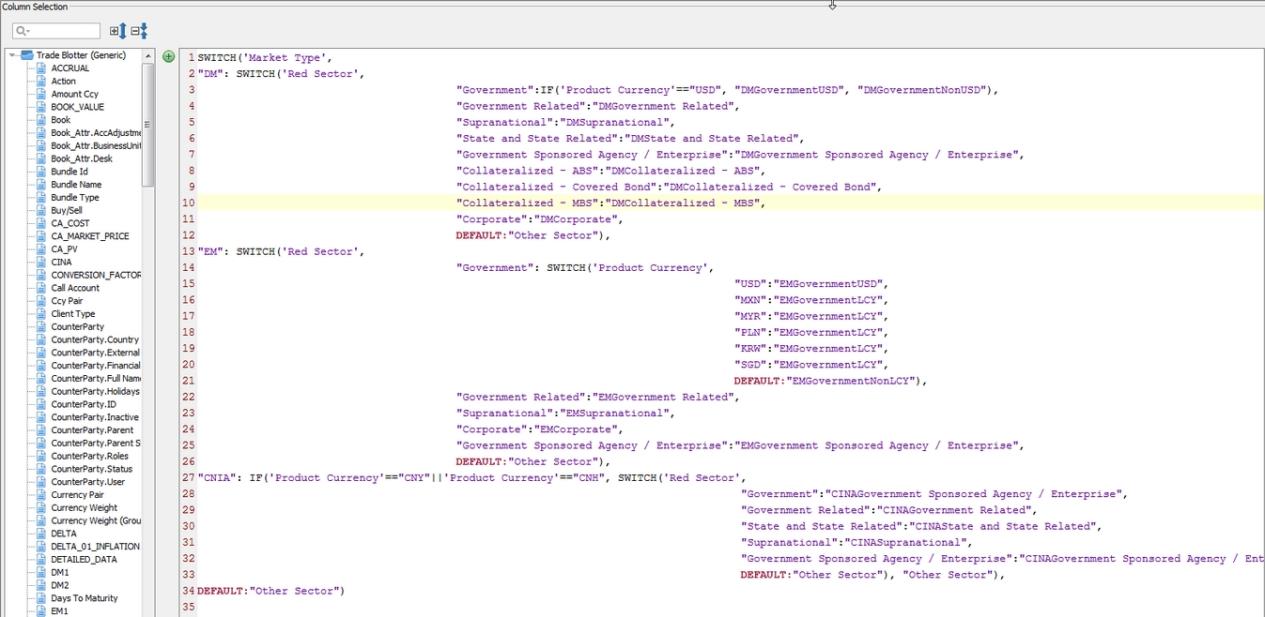
Example
The example below defines a column that depends on a book attribute, the issuer sector, and the underlying currency. The SWITCH is used to test all cases and define the required output. If an instrument is not one of the cases then it is labeled as "Other Sector".
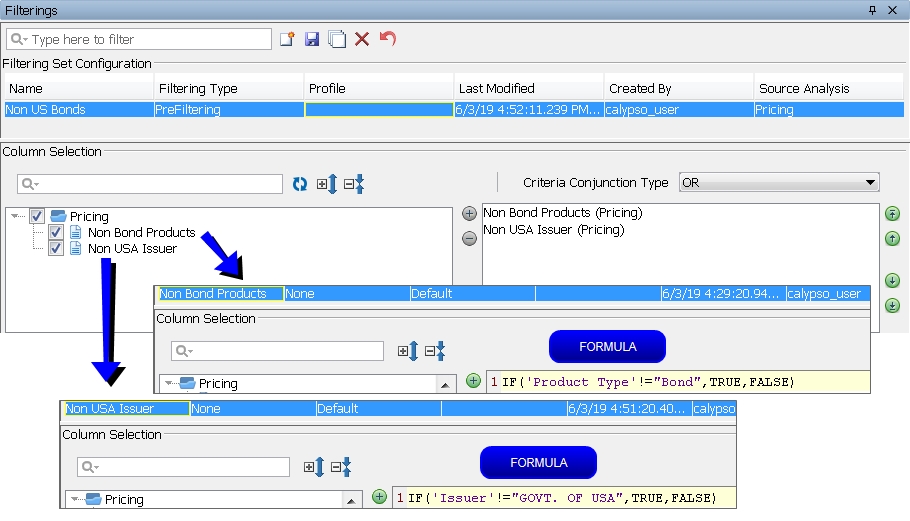
3.7 Filterings
The Filterings window allows configuring filters which can be applied to Portfolio Workstation analyses, either before or after the calculation of aggregations. (The underlying analysis is always run on the full scope.)
A filter consists of several formula columns, the "criteria", whose return values are Boolean, so before you can configure a filter, you need to define formula columns as needed.
See Column Formulae for details on defining Boolean formula columns.
| » | Click |
| » | Select the Filtering Type: |
| – | PreFiltering: The lines will be removed before the aggregated numbers are calculated. |
| – | PostFiltering: The aggregated numbers will be calculated and then the lines will be removed. |
| » | Select the desired criteria from the available Boolean formula columns displayed in the Column Selection area. |
| » | Select the Criteria Conjunction Type: |
| – | AND: All of the conditions must be met. |
| – | OR: Any of the conditions may be met. |
| » | Click |
A filter is attached to a layout, and the user can select a layout when selecting a portfolio.
3.8 Colorings
The Colorings configuration item is only available if the environment property PWS_COLORING_ACTIVE=true is set.
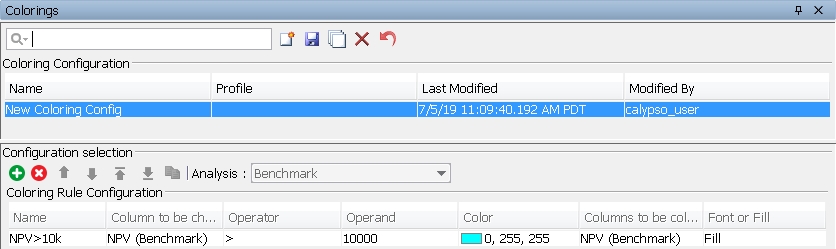
The Colorings window allows defining conditional formatting.
| » | Click |
Profiles allow restricting the use by user group.
| » | In the "Configuration selection" area, select the analysis to which the coloring applies. |
| » | In the "Coloring Rule Configuration" area, enter a name for the configuration. |
Select the column to be checked.
Select the condition to be checked and enter the value to be checked in the Operator and Operand columns, respectively.
Select the color to be applied when the condition is met, and select the column(s) to be colored.
Select Font to apply the color is applied to the column text, or Fill to apply it to the background.
| » | Click |
A coloring configuration is attached to a layout, and the user can select a layout when selecting a portfolio.
3.9 Column Sets
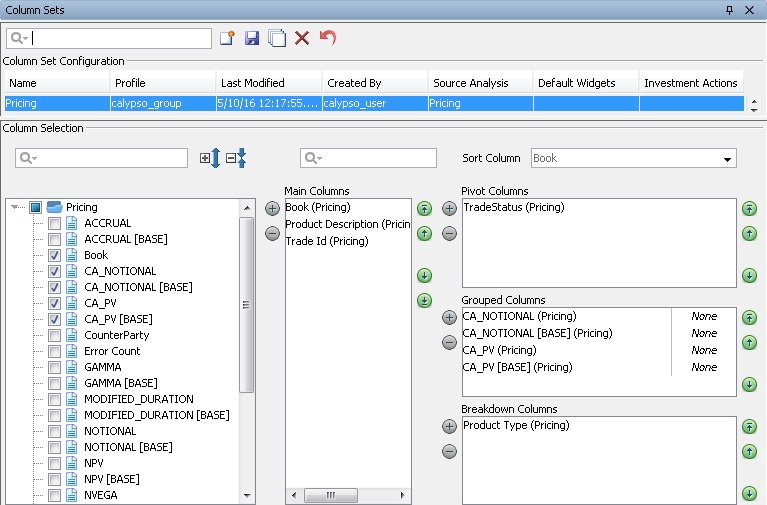
The Column Sets window allows selecting which columns to display for each analysis.
| » | Click |
Profiles allow restricting the display of the column set by user group.
Default widgets will be opened automatically with the associated view. Widgets are described in the next section.
The Investment Actions specified here will be available in the Order Generation panel.
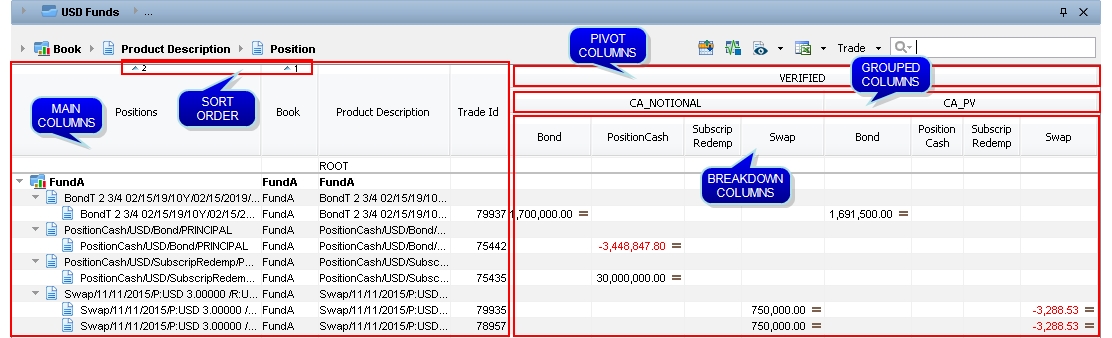
| » | In the "Column Selection" area, select an analysis, then select a column and add it to the Main Columns, Pivot Columns, Grouped Columns, or Breakdown Columns as needed. At least one column must be selected in the Main Columns area. Grouped columns are the columns displayed for a given pivot column, and breakdown columns are the columns displayed for a given grouped column. |
Ⓘ [NOTE: For a given column set you can only select columns from one analysis - You need to define a separate column set for each analysis]
Ⓘ [NOTE: When using pivot columns, the first column in the Main Columns area must be non-numerical]
You can re-arrange the columns in each area.
You can indicate if any of the main columns should remain fixed or not when scrolling.
You can indicate if any of the grouped columns should be summed or not.
In the Sort Column field, you can specify the sort order and whether ascending or descending. The main columns are available for selection here.
| » | Click |
A column set is attached to a layout, and the user can select a layout when selecting a portfolio.
3.10 Widgets
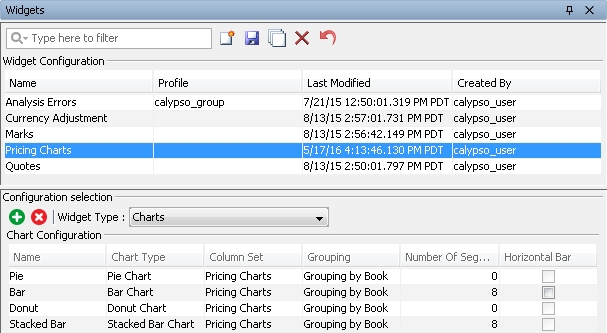
The Widgets window allows configuring additional windows.
| » | Click |
| » | In the "Configuration selection" area, select the widget type: |
| – | Charts: Displays charts. |
| – | Analysis Errors: Displays analysis errors. |
| – | Marks: Displays the Official P&L Mark analysis. |
| – | Orders: Displays orders. |
See Orders Widget for configuration details.
| – | Quotes: Displays quotes. |
| – | Currency Adjustment: Displays the currency adjustments history, and allows amending the adjustments. |
| – | Liquidation: Displays detailed information on a position, including buy/sell trades, corporate actions, and several metrics. |
| » | For charts widgets, click |
NOTE: The column set must only contain columns using the Position Item aggregation mode, and these columns must also be contained in the analysis' column set. You need to define a separate chart widget per analysis.
For bar and stacked bar charts, define the maximum number of segments. Segments in excess of the maximum are grouped together in an "Other" segment.
The top bar chart and bottom bar chart display the top or bottom number of segments chosen, regardless of the sorting columns in the column set.
You can make a bar chart horizontal instead of vertical by selecting the "Horizontal Bar" checkbox.
| » | Click |
A widget is attached to a layout, and the user can select a layout when selecting a portfolio.
3.11 Groupings
The Groupings window allows creating groupings. Groupings are used to specify how analyses are aggregated. A grouping can be used by multiple analyses, provided they share the criteria.
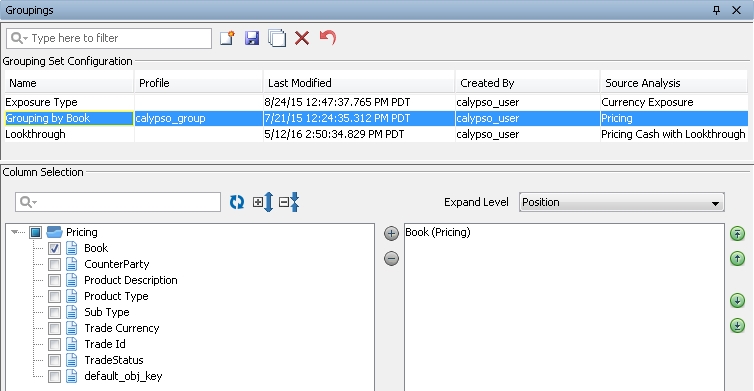
| » | Click |
| » | For each analysis, select a column in the "Column Selection" area, and add it to the grouping as needed. |
Grouping levels appear at the top of the analyses:
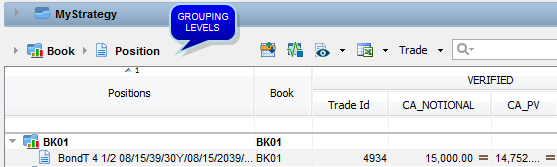
In the Expand Level field, you can select the default level to expand when applying the grouping.
| » | Click |
A grouping is attached to a layout, and the user can select a layout when selecting a portfolio.
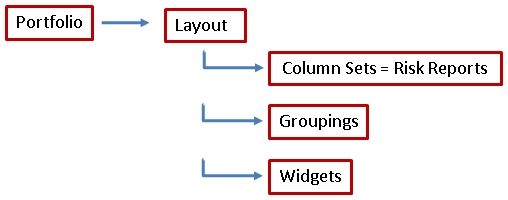
3.12 Layouts
The Layouts window allows defining layouts which combine column sets, groupings, and additional settings to display the analyses when a portfolio is selected.
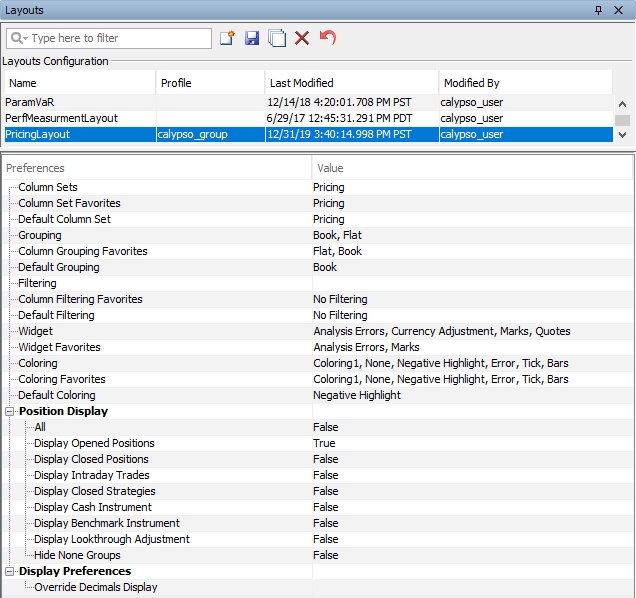
| » | Click |
| » | Select the column sets you want to display, favorite column sets, and default column set as needed. They will be displayed in the layout plan so that you can display different column sets as needed. A column set corresponds to a given analysis. |
| » | Select the groupings you want to use, favorite groupings, and the default grouping as needed. They will be displayed in the layout plan so that you can use different groupings as needed. |
| » | Select the widgets you want to use, and favorite widgets as needed. They will be displayed in the layout plan so that you can use different widgets as needed. |
| » | Select the colorings you want to use, favorite colorings, and the default coloring as needed. They will be displayed in the layout plan so that you can use different colorings as needed. |
| » | Set the various Position Display attribute defaults to True or False. They can be toggled in the analysis using |
| » | Layout Override should be used not the Global Decimal of the previous section, or rely on the instruments' natural decimal conventions. |
See Display for details on global decimal display.
| » | Click |
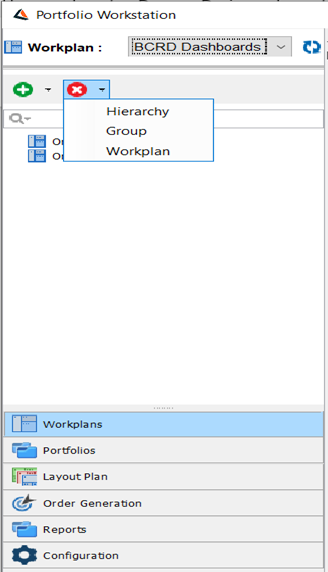
3.13 Workplan View
The workplan view in PWS allows the configuration and creation of Dashboards containing all relevant information at a glance. These new views include Portfolio Views with different analyses outputs. Workplans will provide users the possibility to have a PWS default dashboard and will provide a platform to more interactive navigation view that PWS is already able to provide (browsing through Analyses, Column Sets, Grouping).
Workplan Navigation Panel
The new PWS component, Workplans, is added to the Navigation Panel.
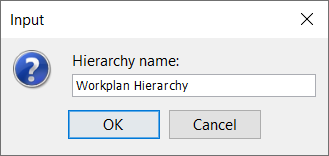
The Workplan Hierarchy: Used to create a workplan, the user needs to add a Workplan hierarchy which provides a way of grouping and segregating workplan views across User Groups. The hierarchy name should be defined.
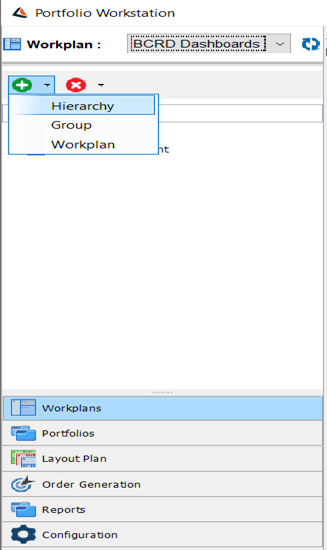
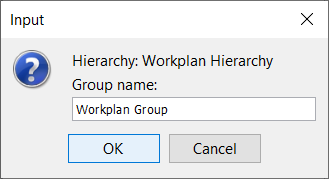
Workplan Group: Simple container of workplan views for structure purposes.
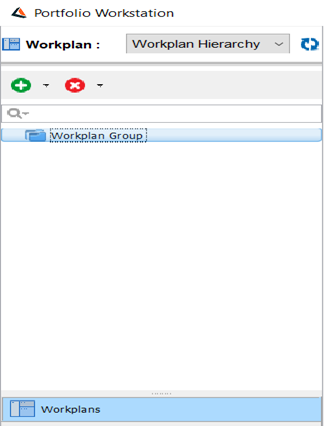
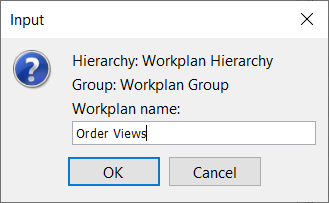
Workplan: A predefined and configurable group of Portfolio Views and Widgets to be opened, consulted, and closed. The Workplan Navigation panel enable users to launch any selected Workplan.
At this point it is possible to switch to Portfolios in the configuration panel and launch the analyses, reorganize them in order to save them in the workplan created and click on Save Workplan.
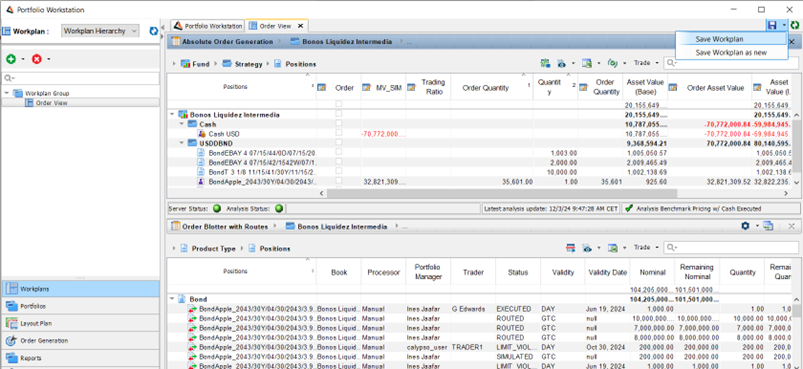
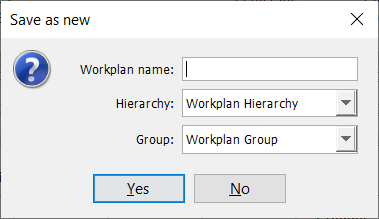
Save Workplan as new: Workplans will be defined and saved from main PWS screen after manually creating a view containing all the Portfolio View and widget elements to be part of the workplan. The user will then enter the name of the new workplan and specify the Hierarchy and the group if needed.
It’s possible to modify the workplan as much as possible, and click on Reset if the user need to restore the first version before the modification or save the Workplan modification.
Delete: Allows the user to delete an existing Workplan, Group or Hierarchy. Only empty Groups and Hierarchies can be deleted.
Portfolio View tool bar
Portfolio View tool bar allows 2 things: Provide immediate access to configuration items linked it and transition from the Workplan View to a Navigation view, by opening a new window for allowing full flexibility on view changes (current PWS functionalities).
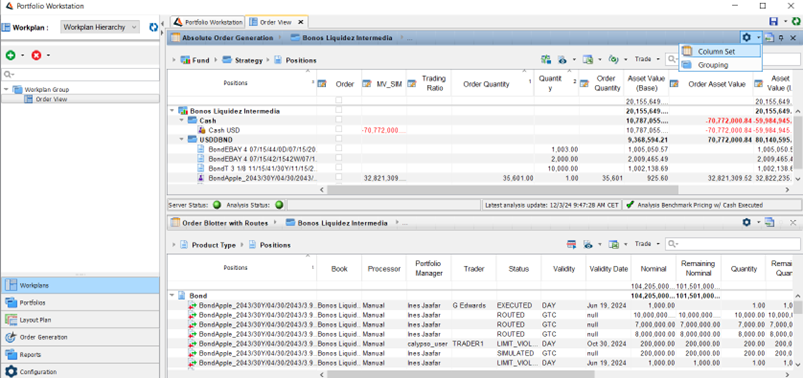
Column Set: It will open Column Set Configuration tab and select the Column Set Configuration item related to this view.
Grouping: It will open Grouping Set Configuration tab and select the Grouping Set Configuration item related to this view. Please note this button will be only visible if applicable (non – flat grouping).
Same if applicable, the Coloring and the Filtering are accessible from the workplan view.
Navigation view Shortcut Button
 : If in workplan view, it will enable the user to open a new tab containing the selected Portfolio View (as if the analysis was launched from Portfolio Hierarchy Navigation Panel). In this Navigation view the user will be able to switch all the related configuration items without affecting the existing Workplan View.
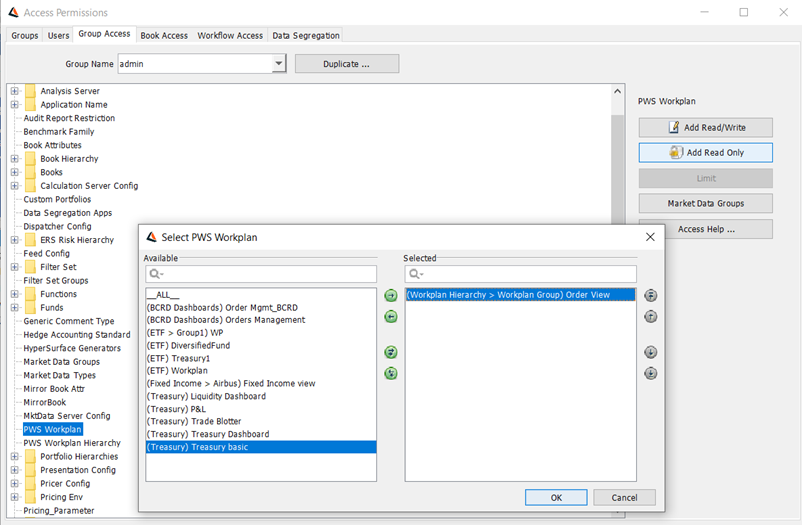
3.14 Workplan View Access Permissions
Workplan Hierarchies will use the same approach being used by Portfolio Hierarchies and Report Hierarchies. In case a user has Read-only access to a specific Workplan Hierarchy, the modification on the Workplan View will not possible.

PWS Workplan is also added in the group access. If a user has Read-only access to a specific Workplan, the modification on the Workplan View will not possible.
4. Supported Analyses
The table below shows which analyses are supported in the Portfolio Workstation and in the Calypso Workstation.
|
Analysis Type and Configuration |
PWS |
CWS |
|---|---|---|
| Pricing | ||
|
Pricing |
X |
X |
| Scenario | ||
|
Scenario |
X |
X |
|
Scenario against Benchmark |
X |
X |
|
Scenario against Benchmark with Lookthrough or Orders |
X |
|
| Simulation | ||
|
Simulation |
X |
X |
|
Simulation against Benchmark |
X |
X |
|
Simulation against Benchmark with Lookthrough or Orders |
X |
|
| Sensitivity | ||
|
Sensitivity |
X |
X |
|
Sensitivity against Benchmark |
X |
X |
|
Sensitivity against Benchmark with Lookthrough or Orders |
X |
|
|
Multi Sensitivity with Hedge Recommendation |
|
X |
| Forward Ladder | ||
|
Cash Ladder (no context position) |
X |
X |
|
Cash Ladder (context position) |
|
X |
|
Security Ladder |
|
X |
| Official P&L | ||
|
Official P&L Explained |
X (simple effects) |
X (full effects) |
|
Official P&L with buy side measures |
X |
X |
|
Official P&L with Cash |
X |
X |
|
Official P&L EOD saved analyses |
|
X |
|
Official P&L intraday (ticking) |
X |
|
| Other | ||
|
Investment Indicators: Real-time Official P&L and Risk |
X |
|
|
Investment PL |
X |
|
|
Performance Measurement |
X |
|
|
PMA |
X |
|
|
Imported NAV measures |
X |
|
|
Currency Exposure |
X |
|
|
Credit Exposure |
X |
|
|
Credit Risk (Jump To Default) |
|
X |
|
Parametric VaR |
X |
|
|
Active (Tracking Error) |
X |
|
|
Order |
X |
|
|
Report To Risk |
X |
|
5. Displaying Analyses
Ⓘ [NOTE: Before running an analysis in the Portfolio Workstation, the Analysis Server specified in the Analysis Server Configuration for that analysis must be running, and a Risk Server with a Market Data Server must also be running]
When you select a portfolio, you select a layout which corresponds to one or more analyses as a layout contains one or more column sets, and each column set contains columns from a given analysis.
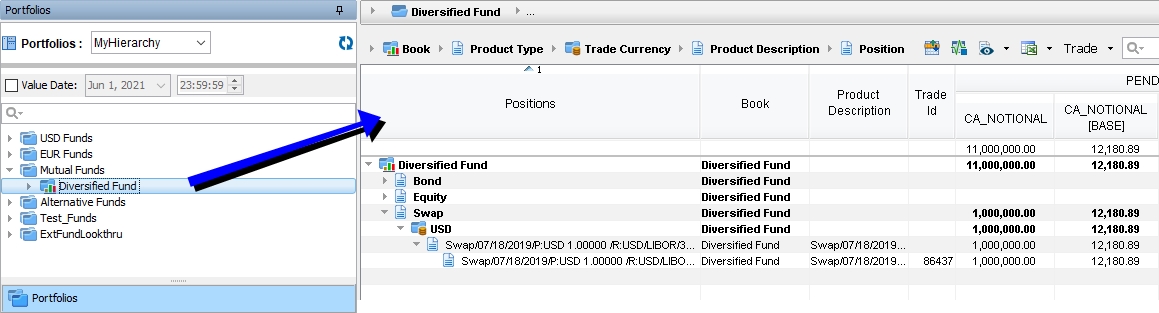
Select Portfolios from the menu:
| » | Select a portfolio hierarchy. |
You can click ![]() to refresh the portfolio hierarchy list.
to refresh the portfolio hierarchy list.
It displays all the components of the portfolio hierarchy.
| » | You can select the "Value Date" checkbox and specify the value date. For Investment Indicators, Official PL, and Investment PL analyses, it is used to specify the starting point for the P&L calculations. |
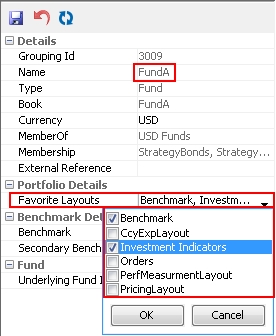
| » | Double-click a portfolio from the portfolio hierarchy. You will be prompted to select a layout if multiple layouts are configured. |
The corresponding analysis will be displayed on the right-hand side.
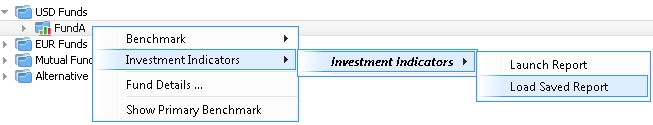
| » | If the portfolio is associated with a favorite layout in the portfolio hierarchy, you can right-click a portfolio and choose the following options: |
| – | <layout> > <column set> > Launch Report – To run the analysis associated with the selected layout. |
| – | <layout > > <column set> > Load Saved Report – To load a saved analysis. You will be prompted to select a saved analysis. |
See Saving Analyses for complete setup details.
| – | <layout> > <column set> > Run Report for Custom Start Date – To run the analysis on a past valuation date. You will be prompted to enter a valuation date. For Investment Indicators, Official PL, and Investment PL analyses, it is used to specify the starting point for the P&L calculations. |
The column sets available are specified in the Column Sets field of the Layouts window.
You can search the positions using the search field.
You can click ![]() to toggle the column pivot and breakdown.
to toggle the column pivot and breakdown.
You can click ![]() to stop real-time updates. You can then click
to stop real-time updates. You can then click ![]() to resume real-time updates.
to resume real-time updates.
You can click ![]() to show / hide different types of positions.
to show / hide different types of positions.
| • | In addition to positions with a quantity of zero, "Display Closed Positions" also applies to trades with a status contained in the tradeMaturedStatus domain. Aggregation is not affected. |
For trades with status in the tradeMaturedStatus domain, if the report is back-dated before the maturity date, it will not contain the trades unless the Maturity Date is selected as part of the column configuration.
You can capture trades from the Trade menu. The Trade menu replicates the Trade menu in Navigator. The Trade button itself is only supported for Bond and Equity products.
You can click ![]() to export the analysis to Excel or CSV.
to export the analysis to Excel or CSV.
| • | If the environment property PWS_EXCEL_SNAPSHOT=true is set, the following menu items are also available: |
| – | Excel Snapshot: Dumps the inputs and outputs of the displayed analysis and aggregation to an Excel file for investigative purposes. |
| – | Excel Snapshot (full): Same as Excel Snapshot, but also includes not needed columns definitions. |
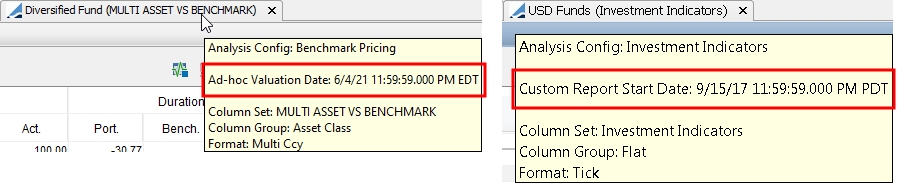
You can hover over an analysis tab to view the adhoc valuation date of saved or back-dated analyses, or for Investment Indicators analysis only, the custom start date.
Active Results
See Tracking Error Analysis for details.
Benchmark Results
See Benchmark Analysis for details.
Credit Exposure Results
Please refer to Calypso Limits & Compliance documentation for details.
Currency Exposure Results
See Currency Exposure Analysis for details.
Forward Ladder Results
Please refer to Calypso Liquidity documentation for details.
Please note the following limitations of the Forward Ladder analysis in Portfolio Workstation:
| • | Only non-context-position-based objectives are supported. |
| – | Cash Ladder: Supported |
| – | FTP: Supported |
| – | PV01 Ladder: Supported |
| – | Behavioral Assumptions: Not supported |
| – | Security Ladder: Not supported |
| • | Known/projected cashflows are shown, but not projected balances. |
| • | Sorting of currency bucket is only possible if you sort by current bucket date first. |
| • | The book must be one of the aggregation criteria of the ladder. |
| • | There is no drilldown cashflow panel. |
Investment Indicators Results
See Investment Indicators Analysis for details.
Official P&L Results
Please refer to Calypso Official P&L documentation for details.
Parametric VaR Results
See Parametric VaR Analysis for details.
Performance Results
See Performance Measurement Analysis for details.
Pricing Results
The Pricing analysis displays the pricer measures that have been selected in the configuration.
Please refer to Calypso Pricing documentation for details.
See Displaying Reports for details.
Sensitivity Results
Please refer to Calypso Sensitivity documentation for details.
6. Configuring Reports
Configuring reports for display in the Portfolio Workstation is similar to configuring analyses. The minimum required configuration is the following;
| » | Specify the desired criteria on a report and save it as a template. |
Note that although you are able to select other report types in the Analysis Server Configuration currently, only the following report types are supported as Report To Risk analyses in the Portfolio Workstation:
| – | BOCashPosition |
| – | ComplianceLEHeadroom |
Please refer to Calypso Limits & Compliance documentation or Calypso Cash Management documentation for details on these reports.
| » | Define a Analysis Server Configuration of type Report To Risk, with the Analysis Parameter using the desired report template. |
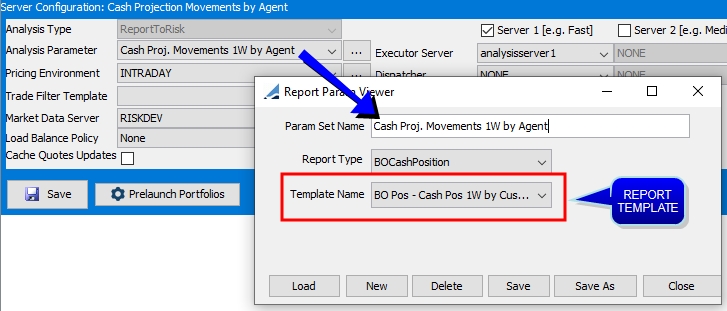
See Analysis Server Configuration for details.
| » | Load the columns for your report. |
See Columns for details.
Note that for the Compliance Legal Entity Headroom report, the ERS Compliance Server must be running in order to load the columns.
| » | Define a column set and add all the available columns. |
See Column Sets for details.
| » | Add the column set to layouts as needed. |
See Layouts for details.
| » | Add the report to a report hierarchy at the desired level. |
See Report Hierarchy for details.
7. Displaying Reports
Ⓘ [NOTE: Before running a report in the Portfolio Workstation, the Analysis Server specified in the Analysis Server Configuration for that report must be running, and a Risk Server with a Market Data Server must also be running]
Report To Risk results are viewed from the Reports menu:
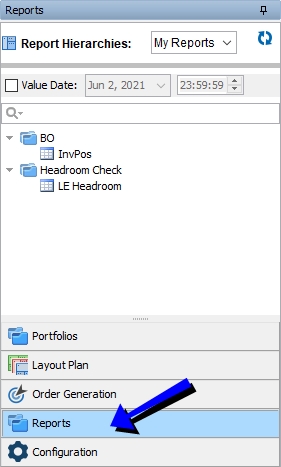
| » | Select a report hierarchy. |
You can click ![]() to refresh the report hierarchy list.
to refresh the report hierarchy list.
It displays all the components of the report hierarchy.
| » | You can select the "Value Date" checkbox and specify the value date. |
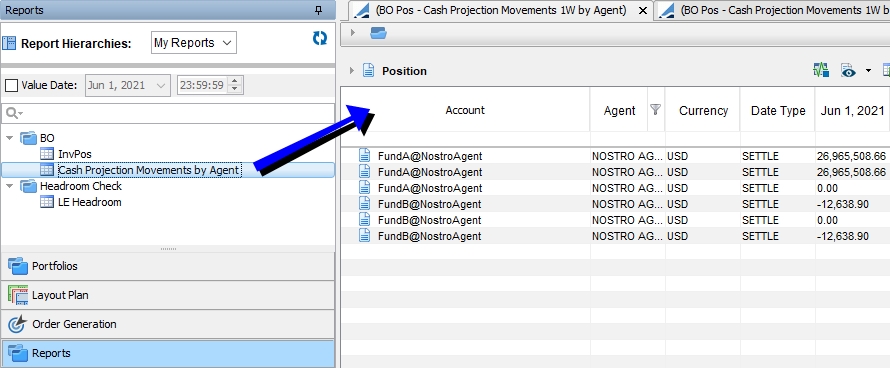
| » | Double-click a report from the report hierarchy. |
If only one layout is configured, the corresponding report will be displayed on the right-hand side.
If multiple layouts are configured, the first layout in alphabetical order is used and the corresponding report will be displayed on the right-hand side.
| » | If the report is associated with multiple layouts, you can right-click a report and choose <layout> > <column set> > Launch Report to run the report associated with the selected layout. |
The column sets available are specified in the Column Sets field of the Layouts window.
You can search the positions using the search field.
You can click ![]() to stop real-time updates. You can then click
to stop real-time updates. You can then click ![]() to resume real-time updates.
to resume real-time updates.
You can click ![]() to show / hide different types of positions.
to show / hide different types of positions.
| • | In addition to positions with a quantity of zero, "Display Closed Positions" also applies to trades with a status contained in the tradeMaturedStatus domain. Aggregation is not affected. |
You can capture trades from the Trade menu. The Trade menu replicates the Trade menu in Navigator. The Trade button itself is only supported for Bond and Equity products.
You can click ![]() to export the report to Excel or CSV.
to export the report to Excel or CSV.
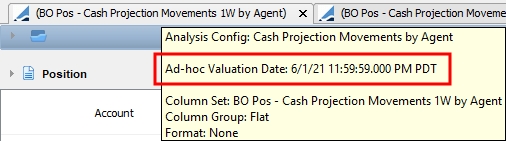
You can hover over a report tab to view the valuation date of saved or back-dated reports, or the custom start date.
8. Using Layout Plans
Once you have loaded a portfolio and a layout, you can play with the layout plan. You can select a different column set or a different grouping as needed, based on the layout configuration.
Select Layout Plan from the menu:
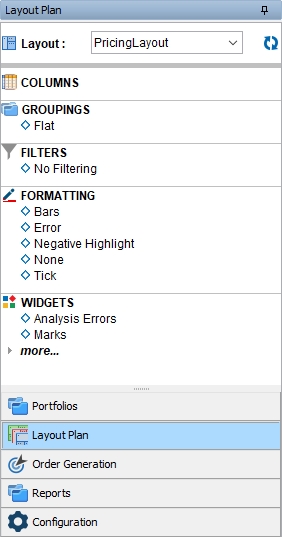
| » | Select a layout, and select the additional items you want to see when you select this layout. |
You can click ![]() to refresh the layout to its default settings, as defined in the Layout window.
to refresh the layout to its default settings, as defined in the Layout window.
| » | Columns – You can select a column set on-the-fly to display the corresponding analysis. |
| » | Groupings – You can select a grouping on-the-fly to display the corresponding grouping. |
| » | Filters – You can select a filter on-the-fly to apply the corresponding filter. |
| » | Formatting – You can set colorings and the following other parameters as needed: |
| – | Negative Highlight: Displays negative values in red. |
| – | Error: Displays errors in red. |
| – | Tick: Next to each value, displays green up arrows for positive values or red down arrows for negative values. |
| – | Bars: Next to each value, displays green bars growing to the right for positive values, or yellow bars growing to the left for negative values. The longer the bar, the larger the column's contribution. |
| » | Widgets – Select widgets as needed. |
9. Pre-launching Portfolios
You can use the scheduled task AM_ANALYSES_START to compute the analyses for the portfolios selected for pre-launch.
You can also use the scheduled task AM_ANALYSES_STOP to stop those analyses.
Configuring the Scheduled Tasks
You can configure the scheduled tasks using Configuration > Scheduled Tasks (menu action scheduling.ScheduledTaskListWindow) from the Calypso Navigator, and adding a task of type AM_ANALYSES_START and AM_ANALYSES_STOP as needed. Both scheduled tasks should have the same configuration.
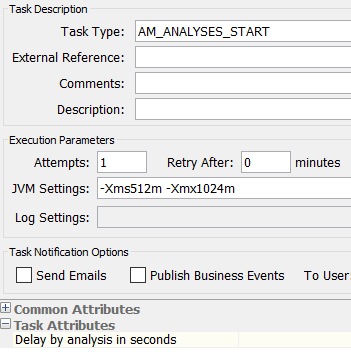
Task Attributes:
| • | Delay by analysis in seconds – Enter the number of seconds of delay between each analysis computation. This field is mandatory. |
Running the Scheduled Tasks
Run the scheduled task AM_ANALYSES_START to compute the analyses.
Only the analyses for which pre-launch portfolios have been selected will be computed.
You can run the scheduled task AM_ANALYSES_STOP to stop the analyses.
10. Stopping All Analyses
You can use the scheduled task AM_STOP_ALL_ANALYSES to stop all analyses (including those being run in the Compliance Analyzer, if any).
Using this scheduled task can improve performance and reduce the resources used by the Analysis Server.
This scheduled task has no task attributes.
11. Saving Analyses
You can use the scheduled task AM_RISK_ANALYSIS to compute the analyses for the portfolios selected for pre-launch. The results for the analysis on each portfolio are saved to the database. You can view the results saved to the database in the Portfolio Workstation.
The following analyses are supported:
| • | Benchmark |
| • | Currency Exposure |
| • | Investment Indicators |
| • | Scenario |
| • | Sensitivity |
| • | Simulation |
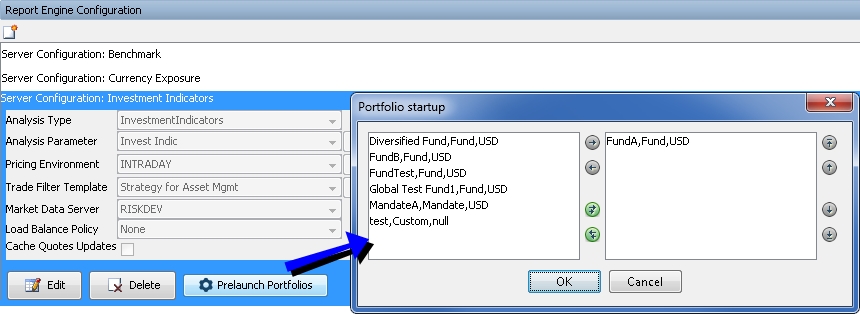
Selecting the Pre-launch Portfolios
In the Analysis Server Configuration window, select the desired analysis and click Prelaunch Portfolios. Select the desired portfolios and click OK.
Configuring the Scheduled Task
You can configure the scheduled task using Configuration > Scheduled Tasks (menu action scheduling.ScheduledTaskListWindow) from the Calypso Navigator, and adding a task of type AM_RISK_ANALYSIS as needed.
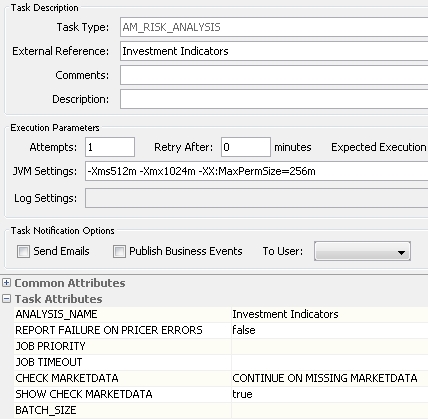
Task Attributes:
| • | ANALYSIS_NAME – Select the name of an analysis defined in the Analysis Server Configuration of Portfolio Workstation. This parameter is mandatory. |
| • | REPORT FAILURE ON PRICER ERRORS – Select true to log pricer errors, or false otherwise. |
| • | JOB PRIORITY – Used by the dispatcher if a dispatcher configuration is defined. |
| • | JOB TIMEOUT – Used by the dispatcher if a dispatcher configuration is defined. |
| • | CHECK MARKETDATA – You can select one of the following options: |
| – | SKIP CHECK MARKETDATA: To run the scheduled task without checking for missing market data. |
| – | CHECK MARKETDATA AND STOP: To only check market data and not run the analysis. |
| – | CONTINUE ON MISSING MARKETDATA: To check for missing market data, and continue even if market data are missing. |
| – | STOP ON MISSING MARKETDATA: To check for missing market data, and interrupt if market data are missing. |
| • | SHOW CHECK MARKETDATA – Only applies if you are running the scheduled task on-the-fly. Select true to bring up the "Missing Market Data" window when checking for market data, if market data are missing. |
| • | BATCH_SIZE – You can specify the number of analyses to be started at a time. Once a batch is completed, the next batch will be started. Note that trades per job, if set, takes precedence over the batch size. |
If no batch size is specified, all analyses will be started concurrently.
Running the Scheduled Task
Run the scheduled task AM_RISK_ANALYSIS for the desired valuation date to compute the analyses.
Displaying the Results
In the Portfolio Workstation, right-click a portfolio and select <layout > > <column set> > Load Saved Report. You will be prompted to select a saved analysis.
Note that the layout must be a favorite layout for this portfolio as defined in the portfolio hierarchy. Otherwise it will not be available in the right-click menu.
12. Launching an Individual Analysis
You can use the scheduled task AM_ANALYSIS_RUN_TASK to start or stop an individual analysis.
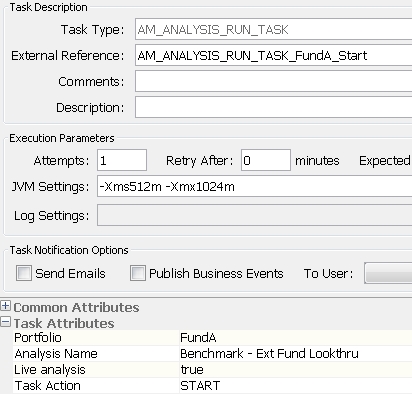
Task Attributes:
| • | Portfolio – Enter the portfolio entry point name or id, as defined in the Portfolio Hierarchy window. |
| • | Analysis Name – Enter the analysis configuration to be run, as defined in the Analysis Server Configuration window. It is also the name as it appears in the Server Status window. |
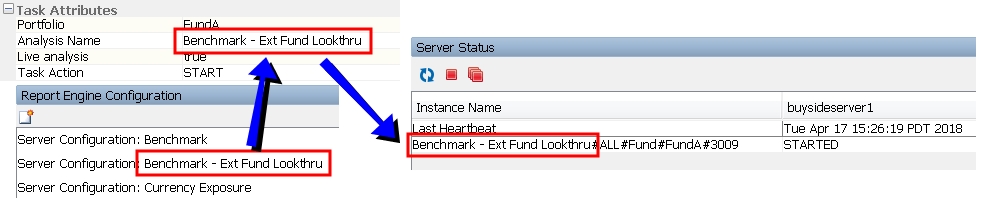
| • | Live analysis – Select true if the scheduled task is run on the current day (val date = today). Otherwise, for back-dated runs, select false. |
| • | Task Action – Select START to launch the analysis, or STOP to stop a running analysis. |
13. Generating Analyses Outside the Portfolio Workstation
Two scheduled tasks are available for generating asset management analyses outside of the Portfolio Workstation.
AM_PWS_REPORTING uses the Analysis Servers. AM_BATCH_REPORTING does not use the Analysis Servers, and therefore does not require them to be running. AM_BATCH_REPORTING can greatly simplify system configuration and operational risks for those not interested in Analysis Server “real time” features.
The type of analysis to be run is determined by the column set selected in the scheduled task. The column set has a source analysis defined, and this source analysis points to the analysis defined in the Analysis Server Configuration.
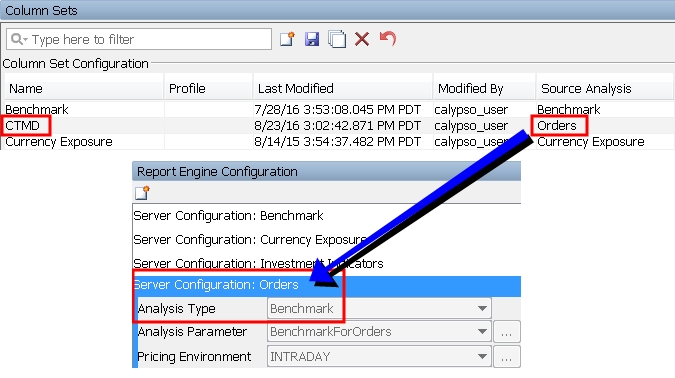
In the example above, selecting the "CTMD" Column Set in the scheduled task will run a Benchmark analysis.
13.1 Configuring the Scheduled Tasks
You can configure the scheduled tasks using Configuration > Scheduled Tasks (menu action scheduling.ScheduledTaskListWindow) from the Calypso Navigator, and adding a task of type AM_PWS_REPORTING and/or AM_BATCH_REPORTING as needed.
Scheduled tasks are added in the domain scheduledTask.
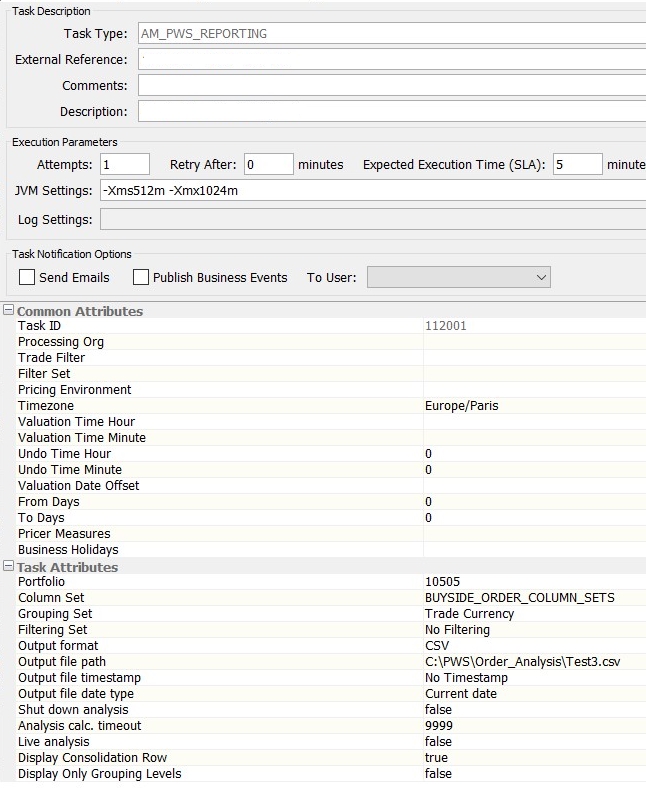
AM_PWS_REPORTING
Task Attributes:
| • | Portfolio – Enter the portfolio entry point name or id, as defined in the Portfolio Hierarchy window. |
For Performance Measurement analyses only, you can enter a strategy. It must be set with the path, for example "Fund/Strat1/Strat2".
For Report To Risk analyses only, this attribute is ignored.
| • | Column Set – Enter a column set name, as defined in the Column Sets window. |
| • | Grouping Set – Enter a grouping, as defined in the Groupings window. |
| • | Filtering Set – Enter a filter to be applied, if desired. Filters are defined in the Filterings window. |
| • | Output format – Select the output format: CSV, EXCEL (non-formatted), FORMATTED EXCEL (formatted with colors, etc.), NONE, or TimeSeries. |
TimeSeries is used for PMA analysis. Selecting TimeSeries will trigger the aggregated view export and save to Buy Side Data Warehouse.
| • | Output file path – Enter the output file path, consisting of directory, file name, and file extension type as appropriate (.xlsx, .csv). |
| • | Output file timestamp – Select the timestamp format to be appended to the file name: Date and Time (<yyyyMMDD>T<HHMMSS>, Date Only (yyyyMMDD), Legacy Format (MM-DD-yyyy), or No Timestamp. |
Note that if you select anything other than Date and Time, and a file with the specified name already exists in the specified directory, it will be overwritten.
| • | Output file date type – You can select "Current date" or "Valuation date" for the reference date of the output file timestamp. Default is "Current date". |
| • | Shut down analysis – Select true to stop the analysis when the scheduled task finishes, or false to leave the analysis running. |
| • | Analysis calc. timeout – Enter the Analysis Server request timeout in seconds. |
| • | Live analysis – Select true if the scheduled task is run on the current day (val date = today). Otherwise, for back-dated runs, select false. |
| • | Display Consolidation Row – Set value to False, the Fund / Consolidated row won’t be printed in the output file. By default, the value is set as True. |
| • | Displaying Only Grouping Level – Set to True, if the Position node figures are not displayed in the final output. By default, the value is set as False. |
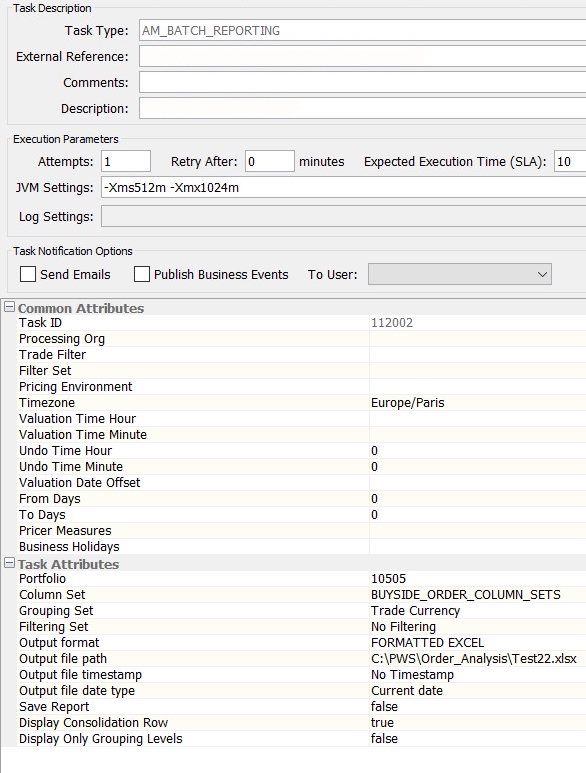
AM_BATCH_REPORTING
Task Attributes:
| • | Portfolio – Enter the portfolio entry point name or id, as defined in the Portfolio Hierarchy window. |
For Performance Measurement analyses only, you can enter a strategy. It must be set with the path, for example "Fund/Strat1/Strat2".
For Report To Risk analyses only, this attribute is ignored.
| • | Column Set – Enter a column set name, as defined in the Column Sets window. |
| • | Grouping Set – Enter a grouping, as defined in the Groupings window. |
| • | Filtering Set – Enter a filter to be applied, if desired. Filters are defined in the Filterings window. |
| • | Output format – Select the output format: CSV, EXCEL (non-formatted), FORMATTED EXCEL (formatted with colors, etc.), NONE, or TimeSeries. |
TimeSeries is used for PMA analysis. Selecting TimeSeries will trigger the aggregated view export and save to Buy Side Data Warehouse.
| • | Output file path – Enter the output file path, consisting of directory, file name, and file extension type as appropriate (.xlsx, .csv). |
| • | Output file timestamp – Select the timestamp format to be appended to the file name: Date and Time (<yyyyMMDD>T<HHMMSS>, Date Only (yyyyMMDD), Legacy Format (MM-DD-yyyy), or No Timestamp. |
Note that if you select anything other than Date and Time, and a file with the specified name already exists in the specified directory, it will be overwritten.
| • | Output file date type – You can select "Current date" or "Valuation date" for the reference date of the output file timestamp. Default is "Current date". |
| • | Save Report – Set to true to save the results to the database. You can view the results saved to the database in the Portfolio Workstation. |
| • | Display Consolidation Row – Set value to False, the Fund / Consolidated row won’t be printed in the output file. By default, the value is set as True. |
| • | Displaying Only Grouping Level – Set to True, if the Position node figures are not displayed in the final output. By default, the value is set as False. |
Ⓘ NOTE: Display Consolidation Row and Displaying Only Grouping Level field’s non-default values support the following analyses only: Benchmark, Investment Indicator, Order, Official PL, Investment PL, and Pricing. To use their non-default values (Display Consolidation Row = FALSE, Displaying Only Grouping Level = TRUE), the Column Set must have Main Columns only.
13.2 Running the Scheduled Tasks
For AM_PWS_REPORTING only, ensure that the Analysis Server is running.
Run the scheduled task AM_PWS_REPORTING or AM_BATCH_REPORTING for the desired valuation date to compute the analysis.
13.3 Viewing the Analyses
Navigate to the directory specified in the Output file path parameter, and open the generated file.