Active Analysis
This document describes how to configure an Active analysis in the Analysis Designer.
The Active analysis allows comparing Portfolio, Benchmark, and Active indicators. While a Benchmark analysis is a simple difference between Portfolio and Benchmark indicators, an Active analysis dynamically creates an active portfolio by purchasing portfolio assets and selling benchmark assets. Then an underlying analysis is run on the three scopes of trades: Portfolio, Benchmark, and Active.
When Parametric VaR is the underlying analysis, it gives the volatility of the active portfolio, also known as the Tracking Error.
Before You Begin
In order to run an Active analysis, you must first configure the following:
| • | An underlying analysis on which the Active analysis will be run. Currently, only Parametric VaR and Investment Indicators are supported. |
 See Parametric VaR Analysis for details on configuring a Parametric VaR analysis and its prerequisites.
See Investment Indicators Analysis for details on configuring an Investment Indicators analysis and its prerequisites.
1. Configuring the Active Analysis
From the Calypso Navigator, navigate to Configuration > Reporting & Risk > Analysis Designer.
Right-click an Active folder, and choose "New Analysis" to configure the parameters. You will be prompted to enter a configuration name.
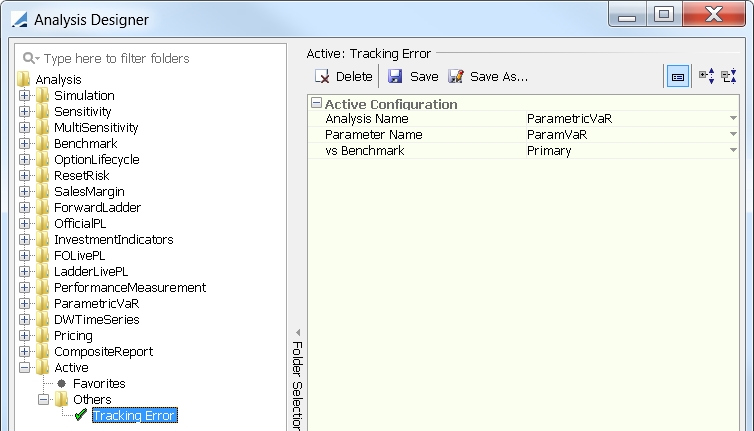
| » | Enter the fields described below as needed, then click Save. |
Active Configuration
|
Indicators |
Description |
|---|---|
|
Analysis Name |
Select the type of analysis on which to run the Active analysis. Currently, only Parametric VaR and Investment Indicators are supported. |
|
Parameter Name |
Select the analysis configuration to be run. |
|
vs Benchmark |
Select the benchmark to be considered. |
2. Running the Active Analysis
You can view the results of the Active analysis in the Portfolio Workstation.
See Portfolio Workstation for information on running the Portfolio Workstation.
Active Analysis Supplemental Columns
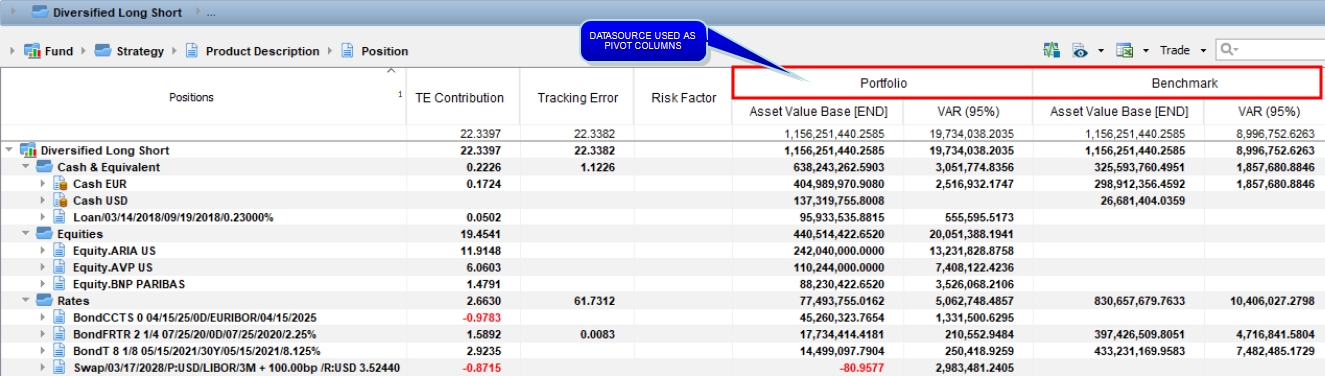
The Active analysis returns the same columns as the underlying analysis, plus the DataSource column to identify the scope: Portfolio, Benchmark, or Active.
Additionally, when the underlying analysis is Parametric VaR, two more columns are added: Tracking Error and TE Contribution. These columns use data from both Benchmark and Portfolio and are not specific to either.
Sample Active Analysis Results
Tracking Error (TE) = The standard deviation of the active portfolio returns relative to the benchmark.

where
Risk GroupingP is the 1xN vector of risk exposures of the portfolio at this grouping level
AVP is the aggregated asset value of the portfolio at this grouping level
Risk GroupingB is the 1xN vector of risk exposures of the benchmark at this grouping level
AVB is the aggregated asset value of the benchmark at this grouping level
R is the covariance matrix
Contribution to Tracking Error (CTE) = The contribution of each asset to the tracking error of the portfolio such that:


where
Risk TotalA is the 1xN vector of total risk exposures of the active portfolio
NAVP is the total aggregated asset value of the portfolio
Risk GroupingA is the 1xN vector of risk exposures of the active portfolio at this grouping level
Total Tracking Error is the overall tracking error calculated by the Tracking Error formula
R is the covariance matrix
Notes:
In theory, the Tracking Error of a given position is zero because it has the same volatility in the portfolio and in the benchmark. But in reality, because the positions don't have the same size, the same shift in the rate curve may not produce a change of value big enough to appear in the same sensitivity analysis. Hence, a small difference in volatility will cause a non-zero Tracking Error at position level.
The above definitions of CTE and TE may result in a TE slightly different from the sum of CTE. The TE uses risk exposures from Portfolio and Benchmark, whereas CTE uses risk exposures from Active, and because the number of securities must be an integer, the risk profile of the Active portfolio is not exactly equal to Portfolio minus Benchmark.