Parametric VaR Analysis
This document describes how to configure the Parametric VaR analysis using the Analysis Designer.
The Parametric VaR analysis allows computing the volatility and the Value at Risk (VaR) using the standard RiskMetrics variance-covariance Delta-Normal approach. It relies on a risk model and a covariance matrix. The risk model is defined in Calypso as a Multi Sensitivity analysis which defines all the types of risk that will be included in the Parametric VaR calculation. The covariance matrix is a square matrix whose dimensions are all of the risk factors found by the Multi Sensitivity analysis. It can be created manually, or created automatically based on historical market data.
Before You Begin
In order to run a Parametric VaR analysis, you must first configure the following:
| • | An "Official" P&L Configuration with Investment P&L measures, and an "Intraday" P&L Configuration. |
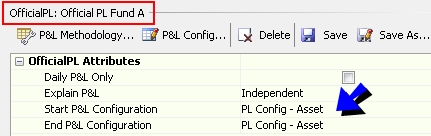
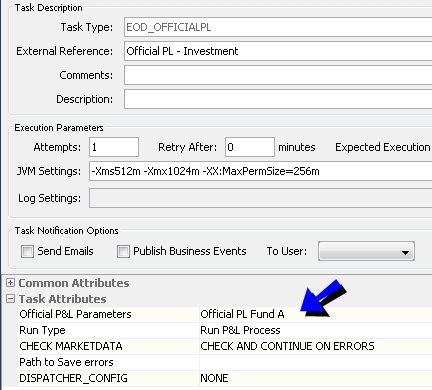
You also need to run the Official P&L analysis for the "Official" P&L Configuration.
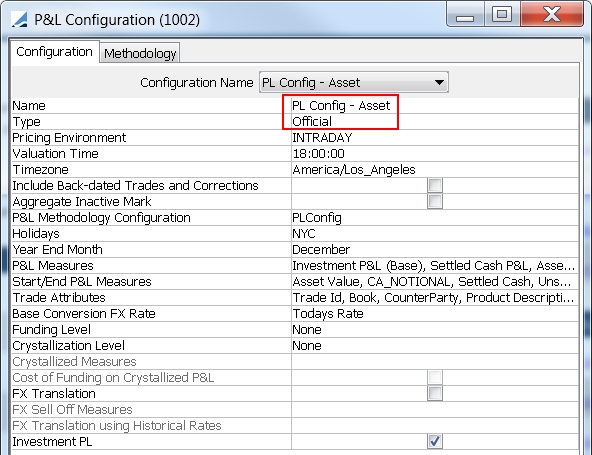
Sample configurations are shown below.
 Please refer to Calypso Official P&L documentation for complete details.
| • | A Multi Sensitivity analysis. |
See Defining a Multi Sensitivity Analysis.
| • | A covariance matrix. |
See Defining a Covariance Matrix.
Sample "Official" P&L Configuration
You can change the type to Intraday, and click Save As to create the "Intraday" P&L Configuration.
Sample Official P&L parameters for the "Official" P&L Configuration
Then run the scheduled task EOD_OFFICIALPL for the Official P&L parameters.
Ⓘ [NOTE: The position spec used to run the scheduled task (in the trade filter) should be the same as the position spec used to run the analysis in the Portfolio Workstation (in the Report Engine Configuration trade filter template).]
1. Supported Risk Types
The following types of risk are supported for Parametric VaR:
| • | Credit risk: Credit curves |
| • | Commodity risk: Commodity curves |
| • | Equity risk: Single stock |
| • | FX risk: FX spot and FX curves |
| • | Inflation risk: Inflation curves (underlyings) |
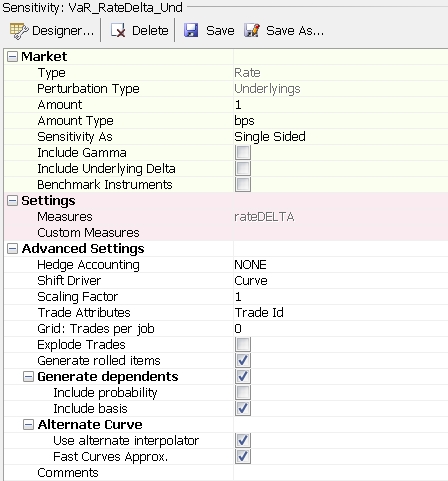
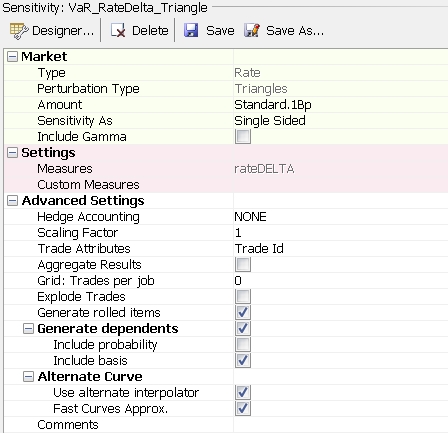
| • | Rates risk: Rate curves (triangles and underlyings) |
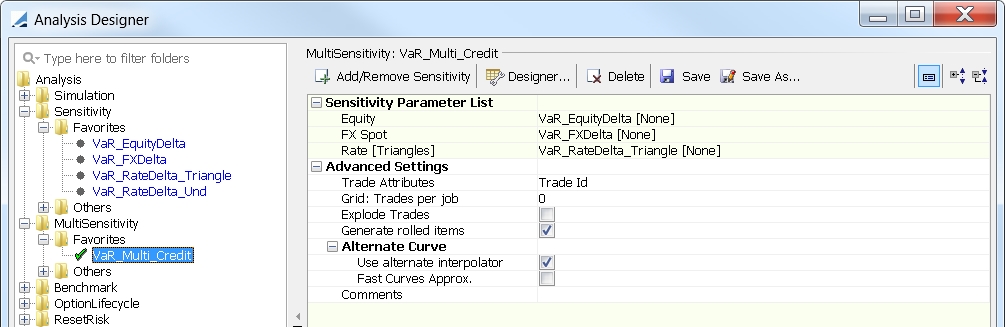
2. Defining a Multi Sensitivity Analysis
The risk model for Parametric VaR is defined in Calypso as a Multi Sensitivity analysis. This determines which types of risk will be considered and how this risk is calculated.
The Multi Sensitivity analysis is a composite analysis which runs a bundle of Sensitivity analyses. For each type of risk to be considered for Parametric VaR, a Sensitivity analysis must be configured.
2.1 Sensitivity Analyses
The recommended Sensitivity analysis setup for each type of supported risk is shown below.
Please refer to Calypso Sensitivity documentation for complete details on configuring Sensitivity analyses.
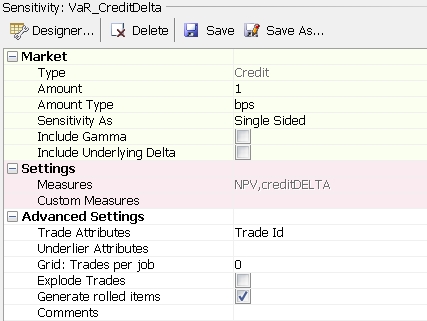
Credit Curve Risk
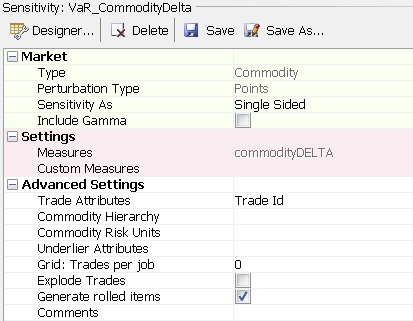
Commodity Curve Risk
Equity Risk
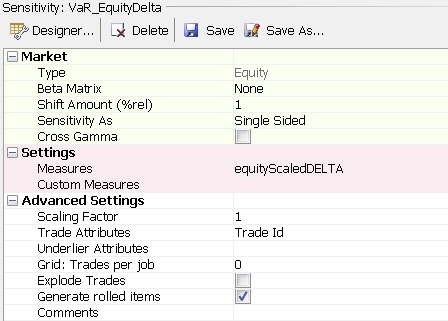
It is important to use the equityScaledDELTA measure which gives the risk amount scaled by the shift which is applied.
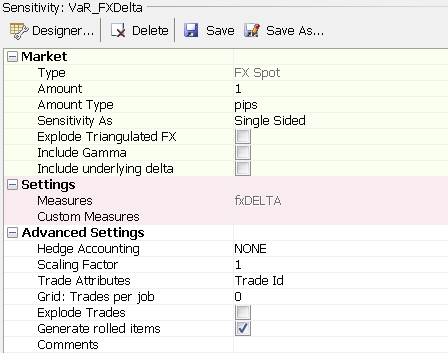
FX Risk
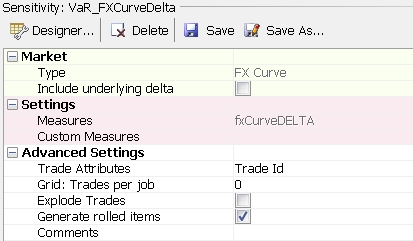
FX Curve Risk
Inflation Curve Risk
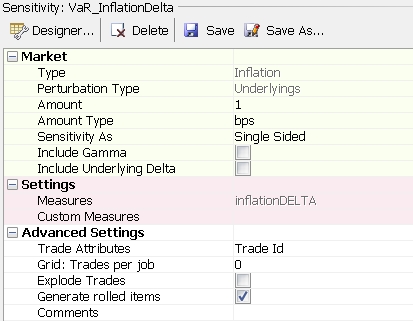
Currently, only the Underlyings perturbation type is supported.
Rates Risk
Rates risk can be evaluated by shifting curve underlyings, or curve points directly (Triangles pertubation type).
Underlyings
Triangles
2.2 Multi Sensitivity Analysis
Once you have configured the Sensitivity analyses, gather them together into a Multi Sensitivity analysis.
Please refer to Calypso Multi Sensitivity documentation for complete details on configuring a Multi Sensitivity analysis.
3. Defining a Covariance Matrix
Covariance matrix creation is done in two phases, both of which can be done manually or automatically.
1. Risk factor discovery, which defines the dimensions of the matrix
2. Calibration, which populates the matrix with data
Domain Values
Before you define a covariance matrix, add the following domain values:
| • | Domain correlationType with value "Parametric" |
| • | Domain CovarianceMatrix.gen with values "Manual" and "Historical" |
3.1 Automated Covariance Matrix
The Historical generator allows automatically discovering the risk factors for a given trade filter and Multi Sensitivity analysis, and it allows calibrating the matrix with historical market data found in Calypso.
From the Calypso Navigator, navigate to Market Data > Correlation & Covariance > Covariance Matrix.
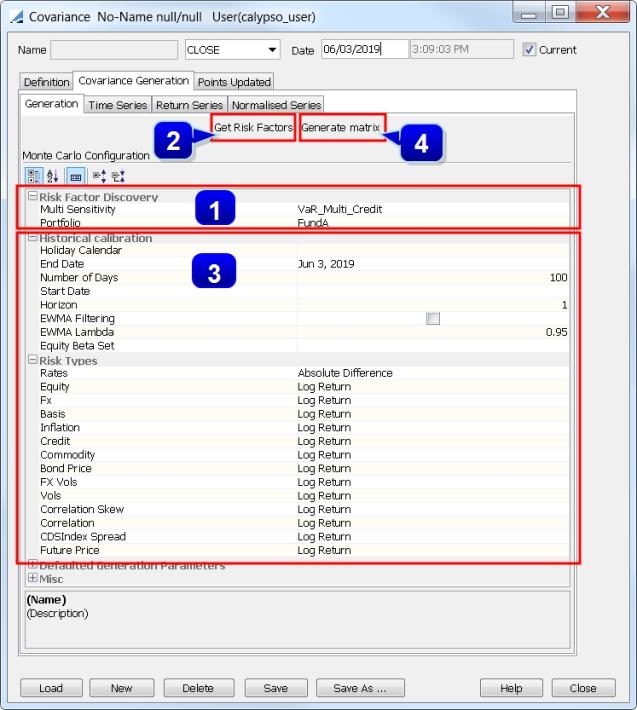
Start a new matrix
| » | Click New to start a new matrix. The Definition panel is selected by default. |
| » | Select the pricing environment. |
| » | Select the generator as Historical. The Derived checkbox is automatically selected, and both axis variables are automatically set to Parametric. |
Discover the risk factors
| » | Select the Covariance Generation panel. The Generation sub-panel is selected by default. |
| » | Enter the "Risk Factor Discovery" parameters described below. |
| » | Then click Get Risk Factors. All the risk factors to which your portfolio is sensitive (according to your risk model) are added in the Definition panel. |
Generate the matrix
| » | Select again the Covariance Generation panel and the Generation sub-panel. |
| » | Enter the "Historical calibration" parameters described below, to define how historical market data will be used to calibrate the matrix. |
| » | Then click Generate matrix. The Points Updated panel is populated with a filled covariance matrix. The Covariance Generation panel's other sub-panels are also populated: |
| – | Time Series: Displays the market data that was found for each risk factor for each business day defined in the date range specified in the "Historical calibration" parameters. |
| – | Return Series: Displays the log returns [Return = ln(data(t) / data(t - Horizon)] based on the above market data. This is the series on which the covariance is calculated. |
| – | Normalised Series: Each return is replaced by [(Return - Mean Return of risk factor) / Standard Deviation of return for risk factor]. This data is not used in the covariance calculation. |
Save the matrix
| » | Click Save in the bottom of the Covariance window. Enter a name for the covariance matrix, and click OK. |
Risk Factor Discovery
|
Fields |
Description |
|---|---|
|
Multi Sensitivity |
Select a Multi Sensitivity analysis to be used as the risk model.
|
|
Portfolio |
Select a portfolio (trade filter). |
Historical calibration
|
Fields |
Description |
|---|---|
|
Holiday Calendar |
The holiday calendar code in Calypso. It is used to determine valid business days. |
|
End Date |
The most recent or end date of the historical period. |
|
Number of Days Start Date |
Number of days +1 for which scenarios need to be generated, as one extra day prior to the first scenario date is required to calculate the first 1-day shift. Input one of these fields and the other will be calculated. |
|
Horizon |
The number of days used to calculate returns (1-day VaR, 10-day VaR, etc.). Currently, only daily returns are supported so it must be set to 1. You can calculate other VaR horizons using the formula: VaR(N Days) = SQRT(N) * VaR(1 Day) |
|
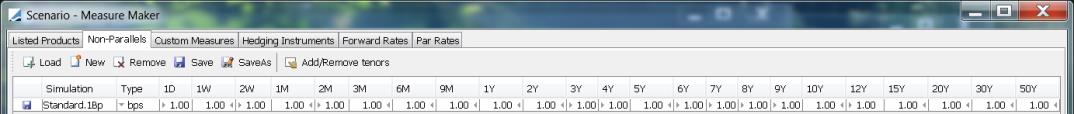
EWMA Filtering EWMA Lambda |
Select 'EWMA Filtering' to evaluate the covariance of return series using the RiskMetrics Exponentially Weighted Moving Average smoothing method. Enter a decay factor between 0.85 and 0.99 to determine the relative weights assigned to the time series. |
|
Equity Beta Set |
Not currently supported. |
Risk Types
You can choose the type of returns computed for each kind of risk. It is recommend to use Absolute Difference for Rates risk (basis point volatility), and Log Return for the rest.
| • | Log Return uses the Arithmetic process. |
| • | Absolute Difference uses the Geometric process. |
Please refer to Calypso Monte Carlo Scenario Analytics for details on the stochastic processes.
Defaulted Generation Parameters
These parameters are not used for Parametric VaR.
Misc
These parameters are not used for Parametric VaR.
3.2 Manual Covariance Matrix
Rather than using Calypso to generate the covariance matrix, you can use one that has been created externally. You can manually create a covariance matrix, or you can upload one using Calypso Data Uploader.
Sample files can be found in <calypso_home>\docs\calypso-datauploader\samples\CovarianceMatrix.
Please refer to Calypso Data Uploader documentation for details on using Data Uploader.
To manually create a covariance matrix, the process is as follows.
Define the risk factors
These risk factors must be added consistently with those configured in your Sensitivity analyses. For instance, if rates curves have been shifted using the Triangles method then you need not add curve underlyings as risk factors.
| » | Add each risk factor as values in the domain ParametricVaRRiskFactors, using the following naming conventions: |
| • | FX risk factors: "FX.<CCY1>.<CCY2>" |
Example: FX.EUR.USD
| • | Equity risk factors: "Equity.<NAME>" |
Example: Equity.GE
| • | Rates risk factors: |
| – | Curve points: "<CCY>.<CURVE_NAME>.<TRIANGLE>" |
Example: USD.FO_USD_LIBOR.1Y
Only needed for Triangles method.
It is recommended to add all the triangles that have been shifted in your Rates Sensitivity even though your portfolio may not be sensitive to all of them, because as time passes your sensitivity points will change.
| – | Curve underlyings: "<INSTRUMENT_NAME>" |
Example: Swap/USD/7Y/LIBOR/3M/LIBOR01/6M
Only needed for Underlyings method.
Define the matrix dimensions
From the Calypso Navigator, navigate to Market Data > Correlation & Covariance > Covariance Matrix.
| » | Click New to start a new matrix. The Definition panel is selected by default. |
| » | Select the pricing environment. |
| » | Select the generator as Manual. The Derived checkbox is automatically de-selected. |
| » | Select the first axis variable as Parametric, and the second axis variable will automatically be set to Parametric as well. Then click ... next to each axis to select the risk factors you want to add to the matrix. |
Populate the matrix
| » | Select the Points panel and click Generate. |
| » | Enter the covariances for each pair of risk factors. You can copy and paste values from Excel. The matrix must be symmetrical and positive semi-definite - if not, an error will be thrown when the Parametric VaR analysis is run. |
Save the matrix
| » | Click Save in the bottom of the Covariance window. Enter a name for the covariance matrix, and click OK. |
4. Configuring the Parametric VaR Analysis
From the Calypso Navigator, navigate to Configuration > Reporting & Risk > Analysis Designer.
Right-click a Parametric VaR folder, and choose "New Analysis" to configure the parameters. You will be prompted to enter a configuration name.
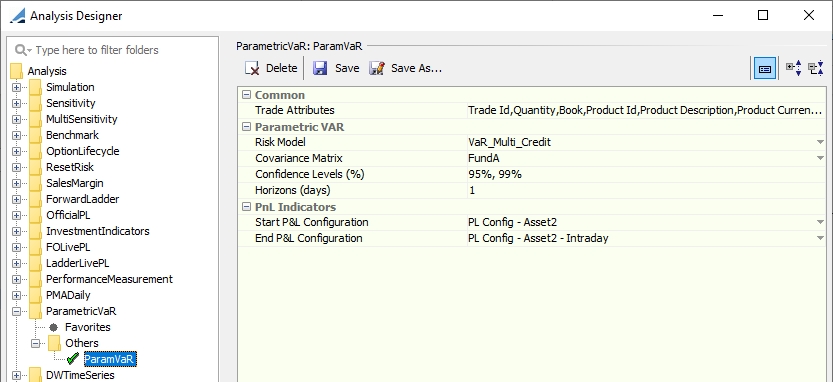
| » | Enter the fields described below as needed, then click Save. |
Common
|
Indicators |
Description |
|---|---|
|
Trade Attributes |
Select trade attributes as needed. |
Parametric VAR
|
Indicators |
Description |
|---|---|
|
Risk Model |
Select a Multi Sensitivity analysis to be used as the risk model.
|
|
Covariance Matrix |
Select a covariance matrix. The matrix's most recent instance as of the val date of the analysis will be used.
|
|
Confidence Levels (%) |
Used for backtesting. The VaR probability. The possible values are configured in the domain ParametricVaRConfidenceLevels. If multiple values are selected, the VaR will be calculated for each combination of Confidence Level and Horizon.
|
|
Horizons (days) |
Used for backtesting. The “look forward” window over which the VaR vs. PL is compared. The possible values are configured in the domain ParametricVaRTimeHorizons. If multiple values are selected, the VaR will be calculated for each combination of Confidence Level and Horizon.
|
PnL Indicators
|
Indicators |
Description |
|---|---|
|
Start P&L Configuration |
Select an "Official" P&L configuration with Investment P&L measures. |
|
End P&L Configuration |
Select an "Intraday" P&L Configuration to be used on the end date. This configuration must have the same parameters as the "Official" P&L configuration with type "Intraday". |
Please refer to Calypso Official P&L documentation for details.
5. Running the Parametric VaR Analysis
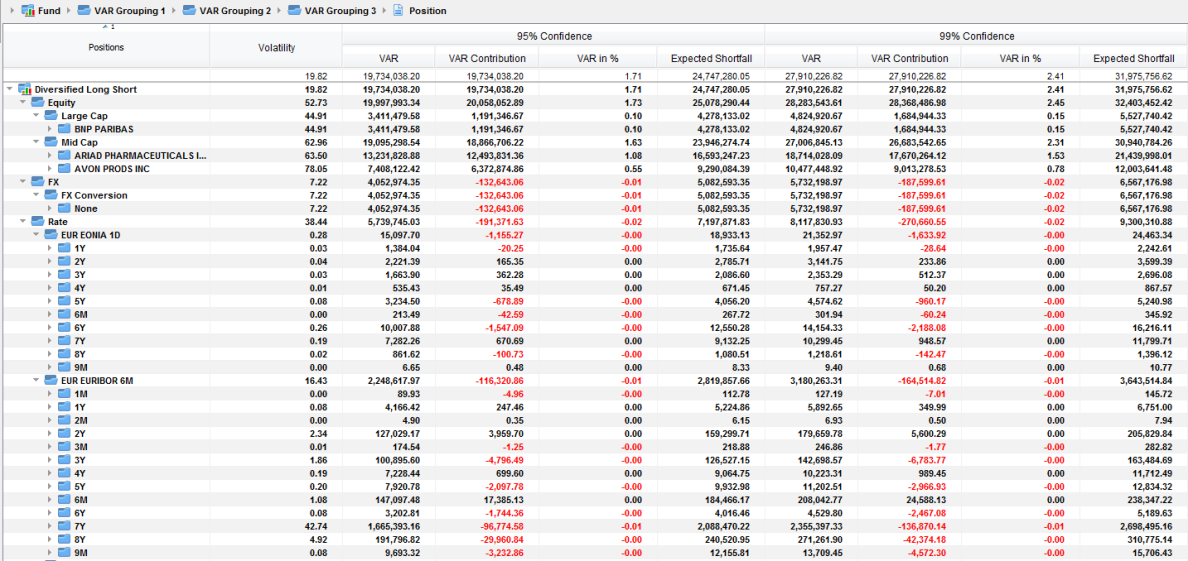
You can view the results of the Parametric VaR analysis in the Portfolio Workstation.
See Portfolio Workstation for information on running the Portfolio Workstation.
Sample Parametric VaR Results
Risk Indicators
Volatility = The volatility of the market value of the asset.
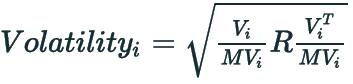
where
Vi is the 1xN vector of risk sensitivities for asset i
MVi is the market value of asset i
R is the covariance matrix
Volatility (Portfolio) = The volatility of the market value of a portfolio or sub-portfolio is a special case of the volatility where:
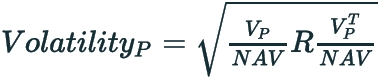
where
VP is the 1xN vector of risk sensitivities aggregated across portfolio P
NAV is the aggregated asset value of portfolio P
R is the covariance matrix
Volatility Contribution = The contribution of each asset to the volatility of the portfolio such that:
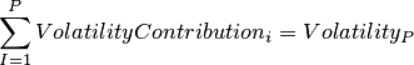
where
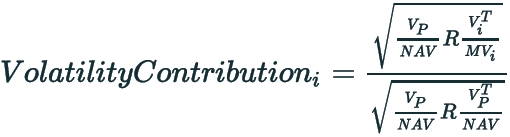
where
Vi is the 1xN vector of risk sensitivities for asset i
VP is the 1xN vector of risk sensitivities aggregated across portfolio P
MVi is the market value of asset i
NAV is the aggregated asset value of portfolio P
R is the covariance matrix
Volatility Weight = The volatility contribution in percentage of the total overall volatility of the portfolio.

Systematic Risk = The ratio of the volatility weight of the asset over the market value weight of the asset. It is a "beta", showing the risk of the asset relative to the weight of the asset.

Marginal Volatility = The change in the total portfolio volatility following an increase of investment of 1 unit of the position or segment.

VaR = The value at risk measured at the asset level.

where
c(α) is the confidence factor for confidence level α (i.e. 1.65 for a confidence level of 95%)
Vi is the 1xN vector of risk sensitivities for asset i
R is the covariance matrix
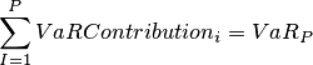
VaR Contribution = The VaR contribution of asset I is the contribution of each asset to the overall VaR of the portfolio, such that:
where

where
c(α) is the confidence factor for confidence level α (i.e. 1.65 for a confidence level of 95%)
NAV is the aggregated asset value of the portfolio
VaR Contribution(%) = The percentage contribution of the asset to the overall VaR of the portfolio.

where
NAV is the aggregated asset value of the portfolio
Marginal VaR = The change in the total portfolio VaR following an increase of investment of 1 unit of the position or segment.

where
c(α) is the confidence factor for confidence level α (i.e. 1.65 for a confidence level of 95%)
Tracking Error = The volatility of the active portfolio, when an Active analysis is run on an underlying Parametric VaR analysis.
See Active Analysis.