Investment Indicators Analysis
This document describes how to configure the Investment Indicators analysis using the Analysis Designer.
The Investment Indicators analysis is a real-time analysis which provides risk and P&L for the portfolio manager.
It allows viewing results from multiple analyses into a single view:
| • | Official P&L results |
| • | Sensitivity results |
| • | Net Asset Value results |
Before You Begin
In order to run an Investment Indicators analysis, you first need to configure the following:
| • | An "Official" P&L Configuration with Investment P&L measures, and an "Intraday" P&L Configuration. |
You also need to run the Official P&L analysis for the "Official" P&L Configuration.
Sample configurations are shown below.
 Please refer to Calypso Official P&L documentation for complete details.
Sample "Official" P&L Configuration
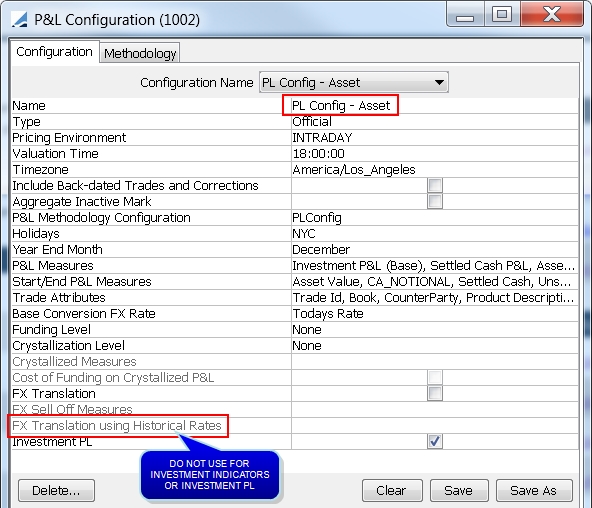
Ⓘ [NOTE: Translation with historical FX rates is not used with Buy Side P&L - In order to ensure matching results between Official P&L and Investment Indicators, it is required that no measures be added to "FX Translation using Historical Rates".]
You can change the type to Intraday, and click Save As to create the "Intraday" P&L Configuration.
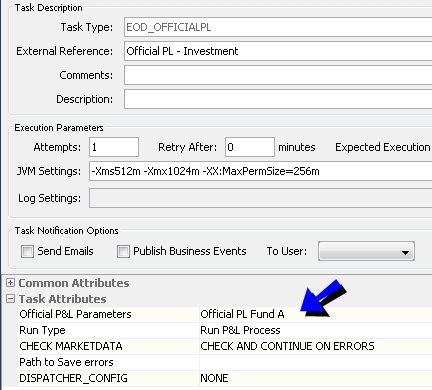
Sample Official P&L parameters for the "Official" P&L Configuration
Then run the scheduled task EOD_OFFICIALPL for the Official P&L parameters.
Ⓘ [NOTE: The position spec used to run the scheduled task (in the trade filter) should be the same as the position spec used to run the Portfolio Workstation analysis (in theAnalysis Server Configuration trade filter template).]
1. Configuring the Investment Indicators Analysis
From the Calypso Navigator, navigate to Configuration > Reporting & Risk > Analysis Designer to configure an Investment Indicators analysis.
Right-click an Investment Indicators folder, and choose "New Analysis" to configure a parameter. You will be prompted to enter a configuration name.
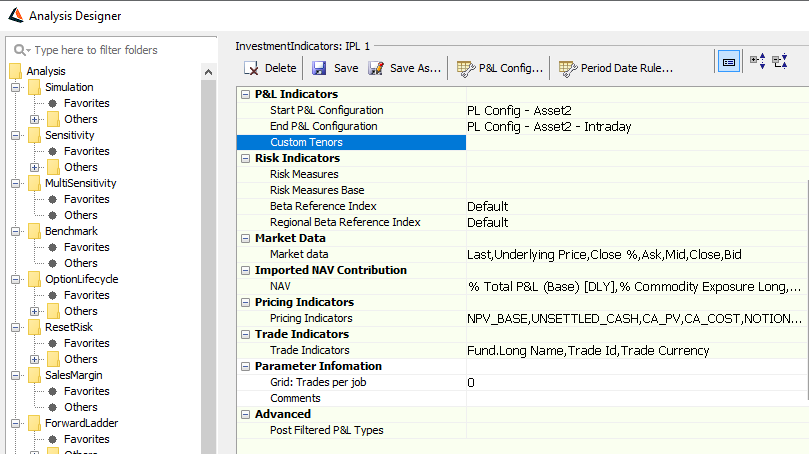
| » | Enter the fields described below as needed, then click Save. |
| » | You can click P&L Config to define a P&L Configuration, as shown in the example above. |
| » | You can click Period Date Rule to configure date rule on toolbar for InvestmentIndicators. |
Please refer to Calypso Official P&L documentation for complete details.
|
Indicators |
Description |
|---|---|
|
Start P&L Configuration |
Select an "Official" P&L configuration with Investment P&L measures. |
|
End P&L Configuration |
Select an "Intraday" P&L configuration to be used on the end date. This configuration must have the same parameters as the "Official" P&L configuration with type "Intraday". You can also select an “Official” P&L configuration to view EOD P&L. |
|
Custom Tenors |
It is a drop-down menu, that allows you to choose one or several date rules from a list. Not more than 10 custom tenor can be configured in the same Investment Indicator Analysis. If more custom tenor are required, then it will be done in a separate Investment Indicator analysis. Ⓘ NOTE: The actual date that will be used as start date for the custom tenor corresponds to the ‘Prev:’ date of the Date Rule when evaluating it using Valuation Date as ‘From Date’ and ‘To Date’ parameters. |
Risk Indicators
You can add risk indicators to the analysis to provide simple risk for equity, FX, commodity, and rate exposures. Simple risk is synthetic risk on one measure resulting from a uniform shift.
Risk in Investment Indicators is based on hard-coded underlying Sensitivity analyses (fxspotDelta, equityDelta, rateDelta, CreditDelta, CommodityDelta) and is not configurable. It gives one line per position.
|
Indicators |
Description |
|---|---|
|
Risk Measures |
Select a list of risk measures to include in the analysis. |
|
Risk Measures Base |
Select a list of risk measures to display in base currency. |
|
Beta Reference Index |
Enter a beta index to use for equity exposure calculations. Applicable to Equities, Dividend Swaps / Futures, Equity Swaps, CFDs, and Equity / Dividend Options.
|
|
Regional Beta Reference Index |
Enter a regional beta reference index to use for equity exposure calculations. Applicable to Applicable to Equities, Dividend Swaps / Futures, Equity Swaps, CFDs, and Equity / Dividend Options.
|
Market Data
|
Indicators |
Description |
|||||||||||||||||||||||||||
|---|---|---|---|---|---|---|---|---|---|---|---|---|---|---|---|---|---|---|---|---|---|---|---|---|---|---|---|---|
|
Market data |
Select market data information.
(Mid- close (D-1)) /close (D-1) where D-1 is the previous business day
|
Imported NAV Contribution
|
Indicators |
Description |
||||||||||||||||||||||||
|---|---|---|---|---|---|---|---|---|---|---|---|---|---|---|---|---|---|---|---|---|---|---|---|---|---|
|
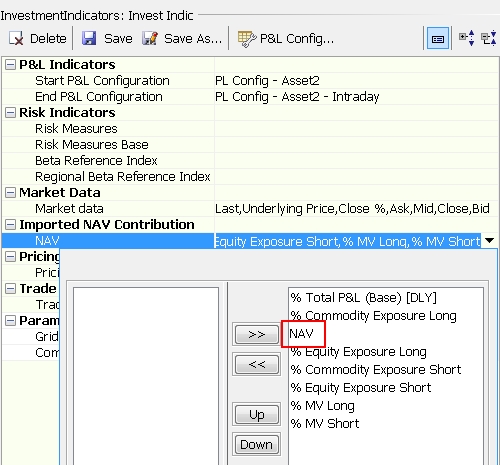
NAV |
Select measures to display as a percentage of the net asset value.
% Commodity Exposure is a delta in cash equivalent. The number is converted to the base currency of the Pricing Environment.
% Commodity Exposure is a delta in cash equivalent. The number is converted to the base currency of the Pricing Environment.
At the equity position level (or OTC trade level), this column is equal to Equity Exposure (base) if positive, divided by the fund NAV as of the previous close. It is 0 if the exposure is negative. Any aggregation level will sum the % Equity Exposure as computed at the equity position or trade level. This measure is expressed in the pricing environment base currency.
At the equity position level (or OTC trade level), this column is equal to Equity Exposure (base) if negative, divided by the fund NAV as of the previous close. It is 0 if the exposure if positive. Any aggregation level will sum the % Equity Exposure as computed at the equity position or trade level.
This column identifies how a specific trade or position contributes to the total NAV. It is equal to the market value (if positive) divided by the latest fund NAV (as of the previous business day end of day). This value works at the trade level and product position level. At a higher aggregation level, this column is the sum of the %MV long number computed at the trade or product position level.
This column identifies how a specific trade or position contributes to the total NAV. It is equal to the market value (if negative) divided by the latest fund NAV (as of the previous business day end of day). This value works at the trade level and product position level. At a higher aggregation level, this column is the sum of the %MV long number computed at the trade or product position level.
This column identifies how the P&L contributes to the total NAV. It is calculated as daily P&L (latest available) / NAV (as stored as of as of the end of last business day). It is expressed in the base currency of the pricing environment.
The fund NAV as imported from an external source.
|
Pricing Indicators
|
Indicators |
Description |
|---|---|
|
Pricing Indicators |
Select a list of pricer measures to include in the analysis.
|
Trade Indicators
|
Indicators |
Description |
|---|---|
|
Trade Indicators |
Select additional trade attributes as needed. |
Parameter Information
|
Indicators |
Description |
|---|---|
|
Grid: Trades per job |
When using a dispatcher, you can define how many trades should be included in a single dispatcher’s job. The Calypso API allows defining weights for the products in order to assign higher coefficients to some more complex trades. In this case, this input will control the weighted number of trades per job rather than the actual number of trades per job. Upon execution, the process will assign trades to the current job until the maximum capacity is reached or exceeded. So the final weighted number of trades in a job can be slightly more than what is defined in the configuration. |
|
Comments |
Enter any comments to be associated with the analysis. |
Advanced
|
Indicators |
Description |
|---|---|
|
Post Filtered P&L Types |
Select the P&L type(s) for which the corresponding positions will be filtered out.
|
2. Configuring Imported NAV
You can display the fund NAV as imported from an external source. The imported NAV is entered as a quote in the format "Fund.<Fund Name>.NAV". The quote for T-1 will be used if it is not available for T.
In order to use imported NAV, you need to set up the following, in addition to the usual analysis configuration requirements.
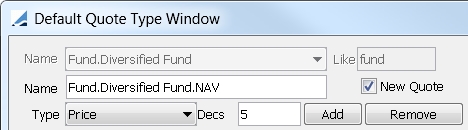
Step 1 – Ensure that the "Fund.<Fund Name>.NAV" quote exists and is fed with the imported NAV.
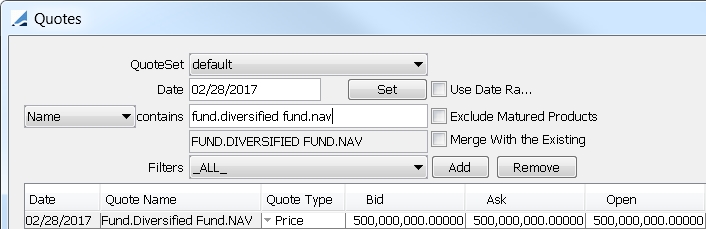
If it does not exist, you can add it from Calypso Navigator > Configuration > Fixed Income > Default Quote Type.
Step 2 – Select the NAV indicator in the Investment Indicators analysis.
See Configuring the Investment Indicators Analysis for complete details on configuring the analysis.
Step 3 – In the Portfolio Workstation, configure the NAV column to be propagated at the fund level.
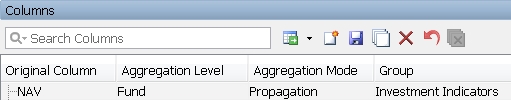
See Portfolio Workstation for complete details on loading and configuring columns.
Step 4 – The imported NAV is not compatible with cash, but you can configure a formula column to report the NAV correctly on every line including cash.
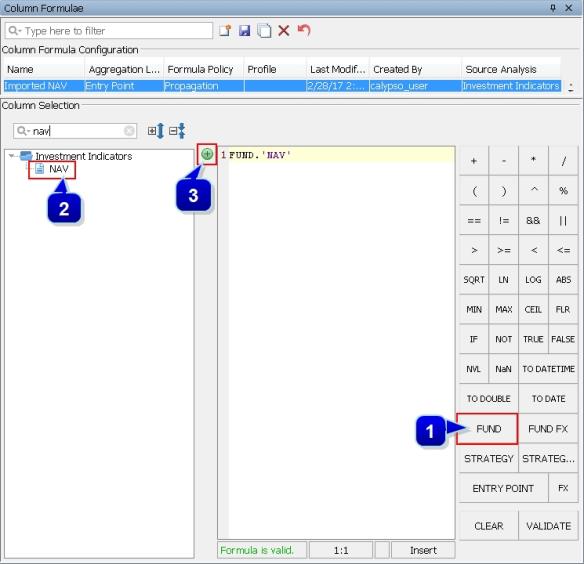
See Portfolio Workstation for complete details on configuring formula columns.
Step 5 – You can define a unit for expressing any measure in % of the imported NAV. Then any column can be cloned and expressed with this unit.
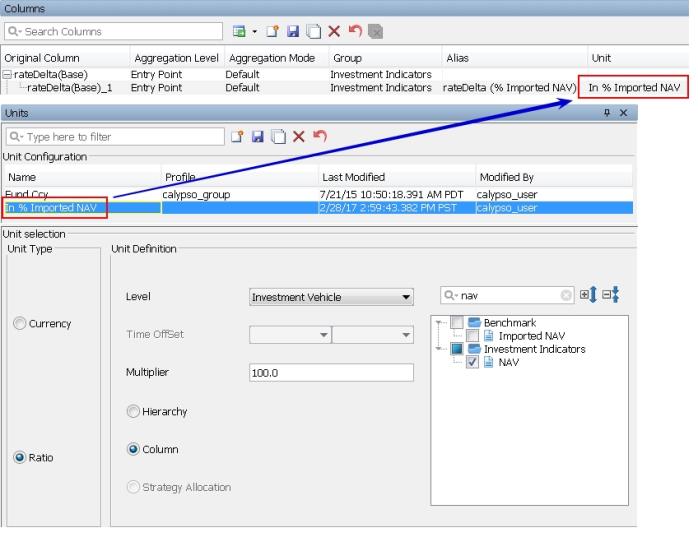
See Portfolio Workstation for complete details on configuring units.
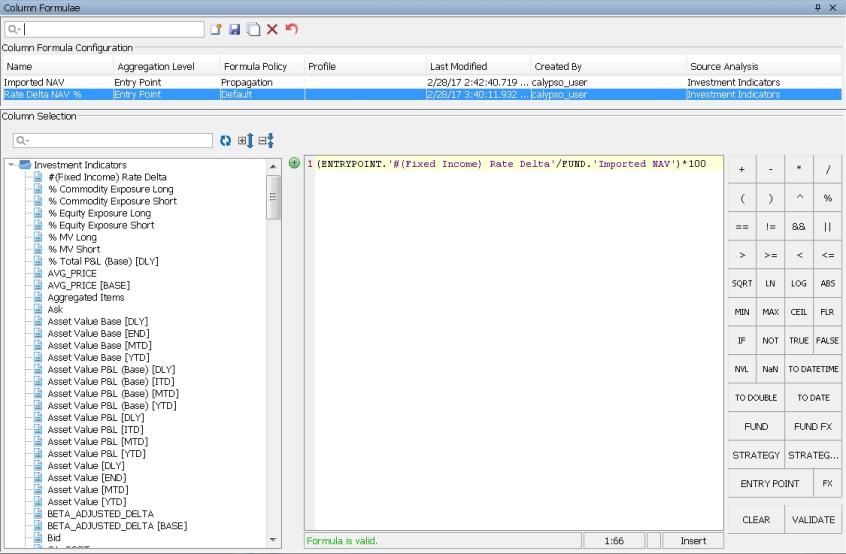
Step 6 – The recommended solution is to configure a formula column to express a ratio.
3. Excluding Canceled Trades
You can exclude canceled trades from the analysis using the following setup.
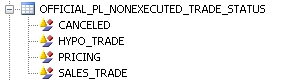
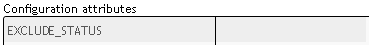
| » | Add the CANCELED status to the list of statuses excluded from Official P&L in the domain OFFICIAL_PL_NONEXECUTED_TRADE_STATUS. |
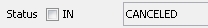
| » | Exclude the CANCELED status in the trade filter template used in the Report Engine Configuration. |
See Portfolio Workstation for details on Report Engine Configuration.
| » | Ensure that the Liquidation engine does not exclude the CANCELED status. |
4. Running the Investment Indicators Analysis
You can view the results of the Investment Indicators analysis in the Portfolio Workstation.
See Portfolio Workstation for information on running the Portfolio Workstation.
Sample Investment Indicators Results
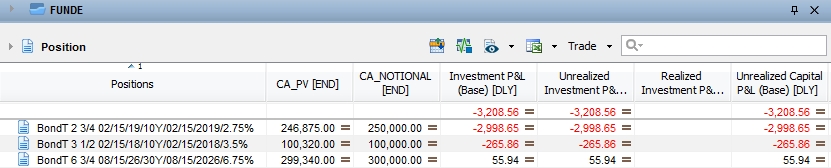
Investment P&L = Realized Investment P&L + Unrealized Investment P&L
Realized Investment P&L = Realized Capital P&L + Realized FX P&L + Realized Cross P&L
Unrealized Investment P&L = Unrealized Capital P&L + Unrealized FX P&L + Unrealized Cross P&L
Realized Capital P&L = Realized P&L from the asset revaluation
Realized Capital Base(t) = Realized Capital Base(t-1) + Realized P&L * fx_buy
Realized Cross P&L = P&L due to the cross effect of capital appreciation and FX movement
| • | OTC Products |
Realized Cross Base(t) = Realized(t) * [fx(t) - Funding Average FX(t-1)]
| • | Position Based Products |
Realized Cross Base(t) = Realized P&L * (fx_sell - fx_buy)
Realized FX P&L = Realized P&L from the FX revaluation
| • | OTC Products |
Realized FX Base(t) = Realized FX Base(t-1) + Decreases in Funding * [fx(t) - Funding Average FX(t-1)]
| • | Position Based Products |
Realized FX Base(t) = [Change in 'Unrealized P&L(t) - Asset Value(t)'] * (fx_sell - fx_buy)
Unrealized Capital P&L = Unrealized P&L from the asset revaluation
Unrealized Capital Base(t) = Unrealized(t) * Funding Average FX(t)
Unrealized Cross P&L = P&L due to the cross effect of capital appreciation and FX movement
| • | OTC Products |
Unrealized Cross Base(t) = Unrealized(t) * [fx(t) - Funding Average FX(t)]
| • | Position Based Products |
Unrealized Cross Base(t) = Unrealized(t) * [fx(t) - Funding Average FX(t)]
Unrealized FX P&L = Unrealized P&L from the FX revaluation
| • | OTC Products |
Unrealized FX Base(t) = Funding Balance(t) * [fx(t) - Funding Average FX(t)]
| • | Position Based Products |
Unrealized FX Base(t) = -[Unrealized(t) - Asset Value(t)] * [fx(t) - Funding Average FX(t)]
Funding Balance
Funding Balance(t) = Settled Cash(t) + Unsettled Cash(t) - Realized(t)
Funding Average FX = Average FX rate of the funding balance
Funding Average FX(t) = [Funding Balance(t-1) * Funding Average FX(t-1) + Increases In Funding * fx(t)] / Funding Balance(t)
Asset Value = CA_PV + Accrual (for bonds)
Settled Cash = CUMULATIVE_CASH
For OTC products, Settled Cash = Settled Proceeds
Unsettled Cash = (Unrealized MTM + Unrealized Accrual + Unrealized Accretion + Unrealized Other + Realized MTM + Realized Accrual + Realized Accretion + Realized Other) - Asset Value - Settled Cash
Please refer to Calypso Official P&L for Buy Side for more details on these measures.