Benchmark Analysis
This document describes how to configure the Benchmark analysis using the Analysis Designer.
The Benchmark analysis allows comparing portfolios to their Benchmarks.
You can compare the results from the following analyses:
| • | Official P&L |
| • | Pricing |
| • | Sensitivity |
| • | Simulation |
| • | Scenario |
 See Defining Benchmarks for information on creating benchmarks.
See Portfolio Hierarchy for information on associating benchmarks to portfolios.
Before You Begin
In order to run a Benchmark analysis, you must first configure the following analyses, depending on which risk results you want to compute and compare:
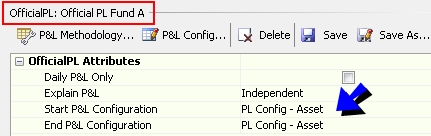
| • | An "Official" P&L Configuration with Investment P&L measures, and an "Intraday" P&L Configuration. |
You also need to run the Official P&L analysis for the "Official" P&L Configuration.
Sample configurations are shown below.
Please refer to Calypso Official P&L documentation for complete details.
| • | A Pricing analysis to compute user-defined pricer measures. |
Please refer to Calypso Pricing documentation for details.
| • | A Sensitivity, Simulation, or Scenario analysis. |
Please refer to Calypso Sensitivity, Simulation, or Scenario documentation for details.
Sample "Official" P&L Configuration
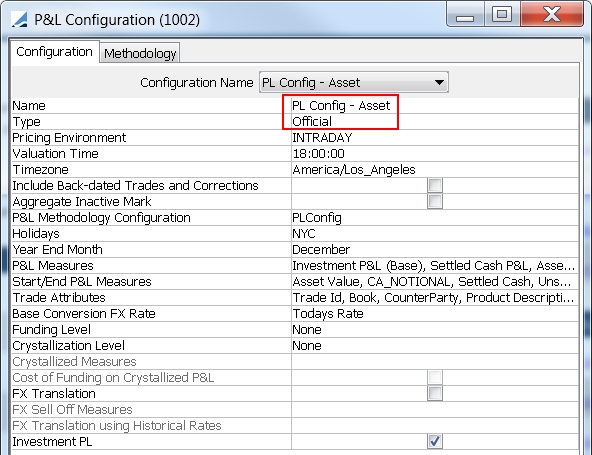
You can change the type to Intraday, and click Save As to create the "Intraday" P&L Configuration.
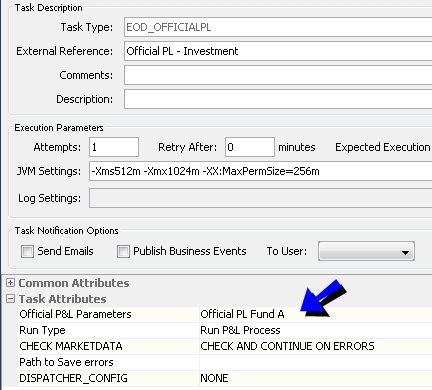
Sample Official P&L parameters for the "Official" P&L Configuration
Then run the scheduled task EOD_OFFICIALPL for the Official P&L parameters.
Ⓘ [NOTE: The position spec used to run the scheduled task (in the trade filter) should be the same as the position spec used to run the analysis in the Portfolio Workstation (in the Analysis Server Configuration trade filter template)]
1. Configuring the Benchmark Analysis
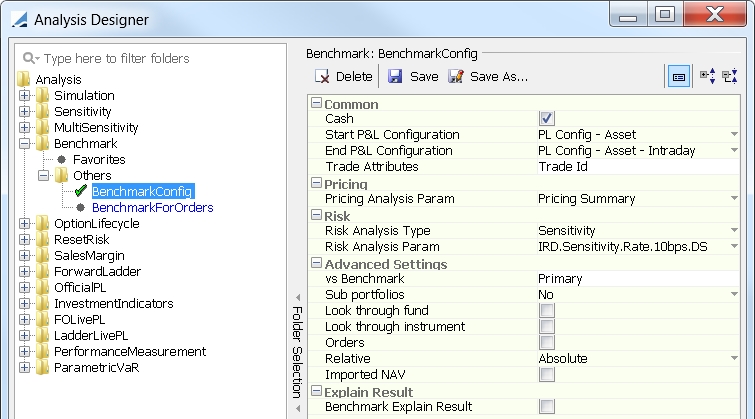
From the Calypso Navigator, navigate to Configuration > Reporting & Risk > Analysis Designer.
Right-click a Benchmark folder, and choose "New Analysis" to configure the parameters. You will be prompted to enter a configuration name.
| » | Enter the fields described below as needed, then click Save. |
Common
|
Indicators |
Description |
|---|---|
|
Cash |
Check to include cash in the output and total portfolio market value. In this case, you need to select a Start P&L Configuration. |
|
Start P&L Configuration |
If including cash, select an "Official" P&L Configuration to be used on the start date. |
|
End P&L Configuration |
Select an "Intraday" P&L Configuration to be used on the end date. This configuration must have the same parameters as the "Official" P&L configuration if any, with type "Intraday". |
|
Trade Attributes |
Select trade attributes as needed. |
Please refer to Calypso Official P&L documentation for details.
Pricing
|
Indicators |
Description |
|---|---|
|
Pricing Analysis Param |
Select a Pricing configuration as needed. |
Please refer to Calypso Pricing documentation for details.
Risk
|
Indicators |
Description |
|---|---|
|
Risk Analysis Type |
Select the type of analysis you want to compute: Scenario, Sensitivity, or Simulation. |
|
Risk Analysis Param |
Select the configuration. |
Please refer to Calypso Scenario, Sensitivity, or Simulation documentation for details.
Advanced Settings
|
Indicators |
Description |
||||||||||||||||||
|---|---|---|---|---|---|---|---|---|---|---|---|---|---|---|---|---|---|---|---|
|
vs Benchmark |
Select which benchmarks to compare the portfolio to. |
||||||||||||||||||
|
Sub portfolios Level |
Specify the strategy level to be the local point for certain relative calculations. The relative calculations show the contribution of an item to its reference points, expressed as percentages.
For 'Yes' and 'Both Portfolio and Sub Portfolio', enter the (benchmark) level, "1" for the first sub-level, "2" for the second sub-level, etc. Example: We want to show "relative quantity", given the following positions in different strategies under the same fund: PosA1 = FundX, StratA, qty = 20 PosA2 = FundX, StratA, qty = 80 PosB1 = FundX, StratB, qty = 60 PosB2 = FundX, StratB, qty = 40
The total fund quantity is 200, and the relative quantity for each position is the percentage contribution with respect to 200: PosA1=10% PosA2= 40% PosB1=30% PosB2=20%
The strategies themselves will be at 100%, but the position values are expressed relative to their strategies: PosA1=20% PosA2=80% PosB1=60% PosB2=40%
There are two values for each position: PosA1=10%(fund), 20%(strategy) PosA2=40%(fund), 80%(strategy) PosB1=30%(fund), 60%(strategy) PosB2=20%(fund), 40%(strategy) |
||||||||||||||||||
|
Look through fund |
Check to activate internal and external funds lookthrough mode, and add "lookthrough" columns.
|
||||||||||||||||||
|
Look through instrument |
Check to activate instrument lookthrough mode, and add "lookthrough" columns.
|
||||||||||||||||||
|
Orders |
Check to add "orders" columns.
|
||||||||||||||||||
|
Relative |
Select "Absolute" to compute absolute values, or "% MV" to compute relative values in percentage of the investment vehicle Market Value. |
||||||||||||||||||
|
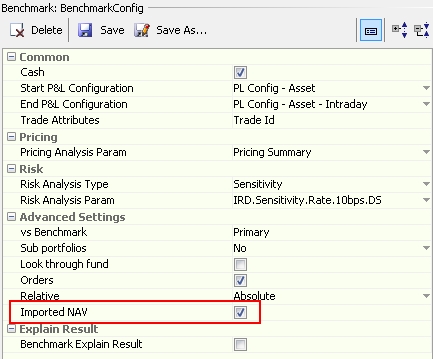
Imported NAV |
Check to display the fund NAV imported from an external source.
If not checked, then the fund NAV will be the sum of the market value of all the trades and positions in the fund, including the cash position. |
Explain Result
|
Indicators |
Description |
|---|---|
|
Benchmark Explain Result Explain Result directory |
If "Benchmark Explain Result" is checked, an Excel file of the explained results will be generated. Specify the directory in which to save the Excel file. |
Benchmark Analysis Columns
Columns are automatically added with a specific suffix depending on the options selected in the benchmark parameters:
<column>_ACT - Active portfolio values (Portfolio minus Benchmark)
<column>_BM - Benchmark values
<column>_MODEL - For Decision Support purposes, when applying an Investment Action from a Model
<column>_REL - Percentage of total MV_BASE of the Portfolio or Sub-Portfolio (Weight)
<column>_SIM - Simulated trade values corresponding to order values
<column>_SUB - When Sub-Portfolio mode is Both, this suffix indicates the Sub-Portfolio columns
<column>_TOTAL - Total value for the Portfolio or Sub-Portfolio
<column>_UNIT - Columns eligible for rebalancing purposes - Unitary values
<column>_WI - What-if portfolio (Portfolio plus Orders)
Multiple suffixes can also be applied at the same time. Example:
<column>_WI_TOTAL = What-if Portfolio total value
<column>_WI_BM = What-if Benchmark (means Benchmark rescaled to Portfolio + Simulation)
2. Configuring Imported NAV
You can display the fund NAV as imported from an external source. The imported NAV is entered as a quote in the format "Fund.<Fund Name>.NAV". The quote for T-1 will be used if it is not available for T.
In order to use imported NAV, you need to set up the following, in addition to the usual analysis configuration requirements.
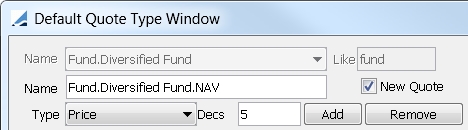
Step 1 – Ensure that the "Fund.<Fund Name>.NAV" quote exists and is fed with the imported NAV.
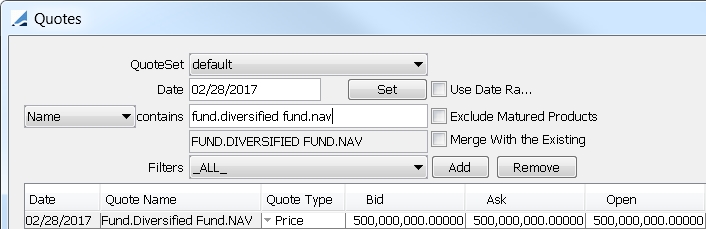
If it does not exist, you can add it from Calypso Navigator > Configuration > Fixed Income > Default Quote Type.
Step 2 – Select the NAV indicator in the Benchmark analysis.
See Configuring the Benchmark Analysis for complete details on configuring the analysis.
Step 3 – The imported NAV is displayed in the MV_BASE_TOTAL column. In the Portfolio Workstation, configure the MV_BASE_TOTAL column to be propagated at the fund level. You can also rename the column with an alias if desired.
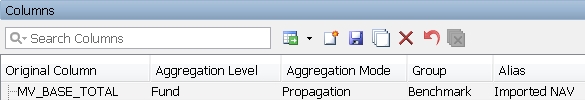
See Portfolio Workstation for complete details on loading and configuring columns.
Note that if cash is included ("Cash" parameter selected in the Benchmark analysis), and the fund currency differs from that of the pricing environment, then the imported NAV will be multiplied by the FX rate.
3. Excluding Canceled Trades
You can exclude canceled trades from the analysis using the following setup.
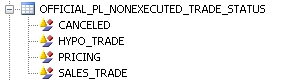
| » | Add the CANCELED status to the list of statuses excluded from Official P&L in the domain OFFICIAL_PL_NONEXECUTED_TRADE_STATUS. |
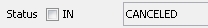
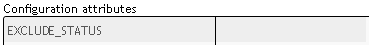
| » | Exclude the CANCELED status in the trade filter template used in the Report Engine Configuration. |
See Portfolio Workstation for details on Report Engine Configuration.
| » | Ensure that the Liquidation engine does not exclude the CANCELED status. |
4. Running the Benchmark Analysis
You can view the results of the Benchmark analysis in the Portfolio Workstation.
See Portfolio Workstation for information on running the Portfolio Workstation.
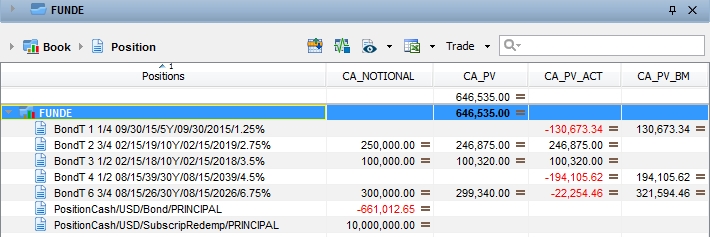
Sample Absolute Benchmark Results
You can check ![]() > Display Benchmark Instrument to display rows for the benchmark instruments.
> Display Benchmark Instrument to display rows for the benchmark instruments.
The PositionCash rows represent the available / invested cash.
Sample Relative Benchmark Results
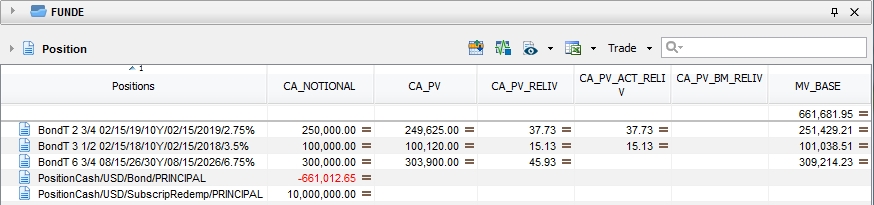
The columns of this picture have been renamed.
Example: CA_PV_RELIV = % of total MV_BASE