Data Server Web Admin
The Data Server Web Admin allows viewing information and logs pertaining to the Data Server.
Default Data Server Web Admin: http://localhost:8100
The Data Server Web Admin also allows the admin to change logging levels and categories and server cache limits. Other run-time control changes are not supported.
The menu items of the Data Server Web Admin application as well as the other servers, are described below.
The Alerts icon ![]() (or menu item Monitoring > Alerts) allows viewing alerts generated by the system.
(or menu item Monitoring > Alerts) allows viewing alerts generated by the system.
 See Alerts for details.
1. Server Menu
The menu items of the Server menu are described below.
1.1 Information
Displays server information such as, Current Server Time, Memory Statistics, Calypso System Settings, and the Active Data Servers list.
| • | Server Information - Current Server Time - The current date and time, in the Calypso reference timezone. All servers and engines run with the Calypso reference timezone. |
| • | Memory Statistics - The Usage, Capacity, Initialized, Used, and Committed statistics for Heap Memory and Non-Heap Memory. |
If the memory usage is too high, see Detecting Operational Anomalies for information on freeing memory.
| • | Calypso System Settings - The current settings of Access Permissions and Authorizations: ON or OFF. |
| • | Active Data Servers - The Name, Host Address, Start Date, and Read-Only (yes/no) particulars of each Data Server that has connected to the current database. |
1.2 Environment Properties
Displays the Environment Properties specified in the ENV file.
1.3 System Properties
Displays the System (JVM) Properties.
1.4 Login Attempts
This window allows viewing, deleting and archiving login attempts.
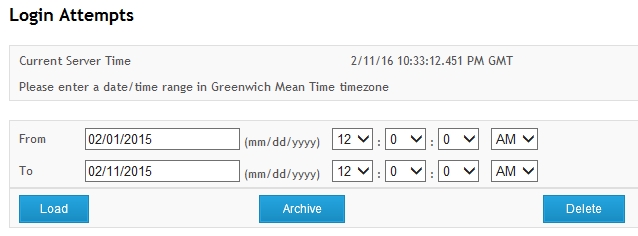
| » | Enter a from and to date and time, and click Load to load the corresponding login attempts. |
| » | You can click Archive to archive the login attempts currently loaded. |
Archived items are moved from the table user_login_att to the table user_login_hist.
| » | You can click Delete to delete the login attempts currently loaded. |
You can disable auditing of login attempts for all users by setting the environment property DISABLE_LOGIN_AUDIT=true.
You can disable auditing of login attempts for a list of users by setting the environment property ACCOUNT_LOGINS_NOT_AUDITED=a list of comma separated user names that should not be audited (only applies if DISABLE_LOGIN_AUDIT=false).
1.5 Restricted Mode
Only applies if the Data Server is started in restricted mode. In restricted mode, only admin users can login into the system, or non-admin users that are explicitly authorized.
This menu item enables the Allow Login function that allows giving login access to non-admin users.
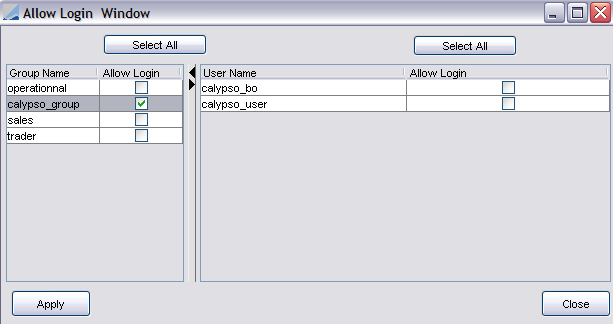
| » | In the group table, you can check "Allow Login" for a set of groups, or click Select All to select all groups. |
| » | In the user table, you can check "Allow Login" for a set of users, or click Select All to select all users. |
| » | Click Apply to allow the corresponding users to login into Calypso. |
1.6 Messenger
Allows the admin to broadcast messages to all client users.
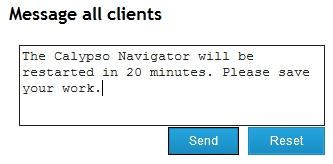
| » | You can enter a message and click Send. |
Ⓘ [NOTE: The maximum message length is 500 characters]
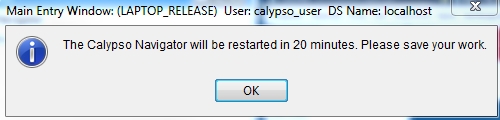
The client applications receive the message below.
1.7 Patcher Audit Information
This window displays the Patcher’s audit log. The log provides a list of all patched files. The application displays the message, "No patcher information is available," if there is no log information.
2. Metrics Menu
The menu items of the Metrics menu are described below.
2.1 Caches
This window allows configuring Data Server caches, evicting trades (i.e., “Trade Removal”), and clearing selected Data Server Caches or all Client Caches.
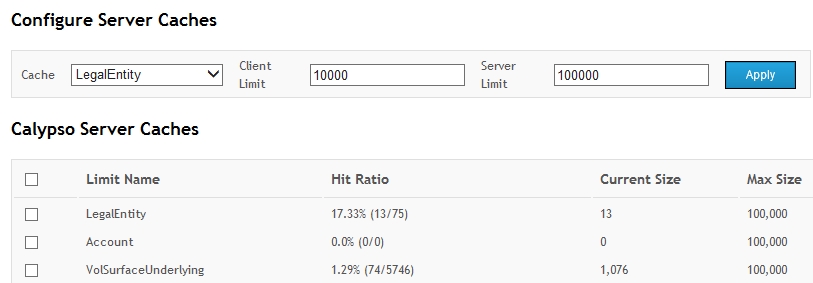
In the Configure Server Caches area, you can set the client limit and the server limit.
| » | Select a cache, and enter the client limit and the server limit. Then click Apply. |
| – | Client Limit - A value of zero means that no limit is enforced on that cache. |
Note that this setting has an impact on the amount of memory that is allocated to the client applications at startup.
| – | Server Limit - A value of zero means that no limit will be enforced on that cache. |
Note that this setting has an impact on the amount of memory that is allocated to the Data Server at startup.
In the Calypso Server Caches area, you can see for each cache:
| • | Limit Name - The cache name. |
| • | Hit Ratio - Percentage of cache requests that returned an object from the cache without having to access the database. |
| • | Current Size - Current number of objects in the cache. |
| • | Max Size - The maximum number of objects held in cache since the last restart. |
You can check one of more Server caches and click Clear Selected Server Caches to clear the corresponding caches.
Although the Client Caches are not displayed, you can click Clear Client Caches to clear all Client Caches. When an user clicks Clear Client Cache, client-side caches of all caches that implements CustomClientCache will be cleared. Client Caches are visible in the Engine Server Web Admin and Risk Server Web Admin under Metrics > Caches.
You can add product types to the domain “productTypeNotInClientCache” so that they are not included in the Product Client Cache.
You can enter a trade ID and click Evict Trade to evict a trade from the cache.
Trade Cache Split
The Data Server trade cache can be split into two different caches, one for Secondary Market Trades and one for OTC trades. This is done using the SPLIT_TRADE_CACHE_ENABLED system property. When the property is activated by setting it to true, two additional limits need to be set, one for each newly added cache. The Limit Name for Secondary Market Trades is SecondaryMarketTrade. The limit name for OTC trades is OTCTrade.
Be aware of appropriately setting the Product Cache Limit Name (limit name Product) for DefaultServer.
If the category com.calypso.tk.core.sql.caches.TradeCacheFactory is enabled (and log level is INFO), the chosen cache shows up on the logs upon initialization.
Additionally, the cache sizes need to be set.
2.2 Task Statistics
This window provides statistics about the tasks of the Task Station based on the task types and their status.
2.3 Pending Events
This window displays the number of pending events per engine and event class.
2.4 Publish Statistics
This window displays statistics about published events.
3. Manage Menu
The Manage > Engines menu allows bringing up the Engine Manager. It is described in the Engine Server Web Admin application.
See Engine Server Web Admin for details.
Manage > Health Check Configuration > Health Check Sensor and Manage > Health Check Configuration > Health Check Subsystem
These menus are used to insert, delete and update health check properties for the hc_sensor and hc_subsystem tables from Web Admin.
These menus are available to admin users only.
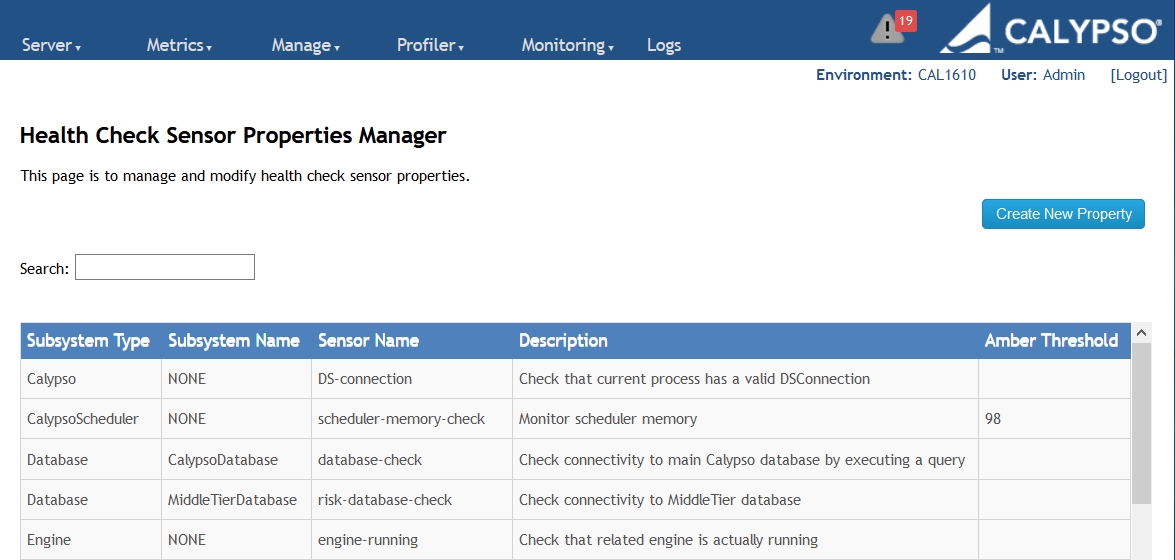
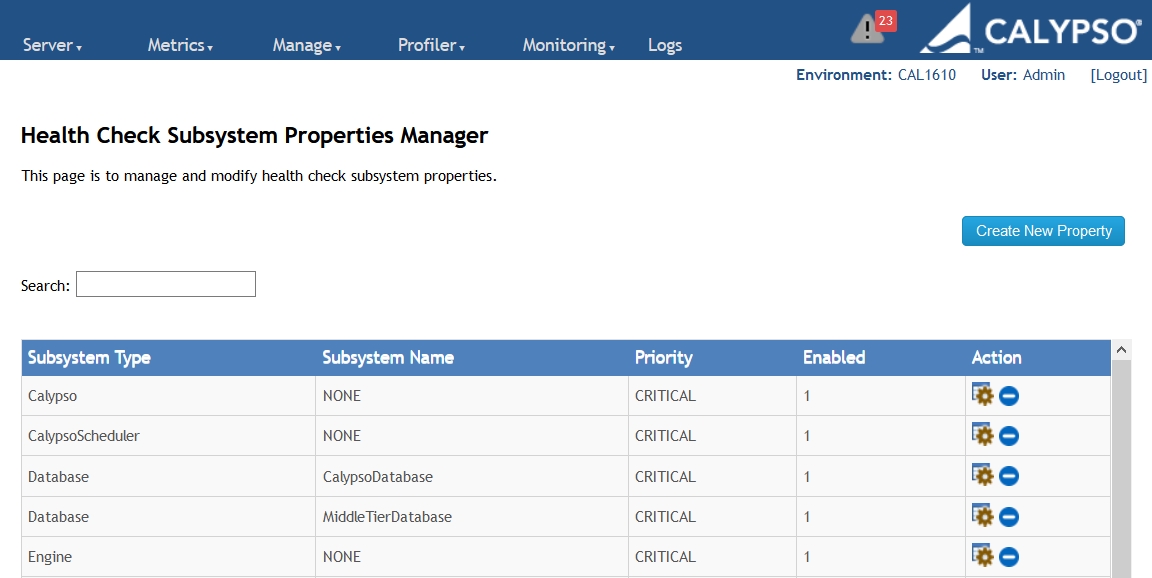
See Health Check for more information.
4. Profiler Menu
The menu items of the Profiler menu are described below.
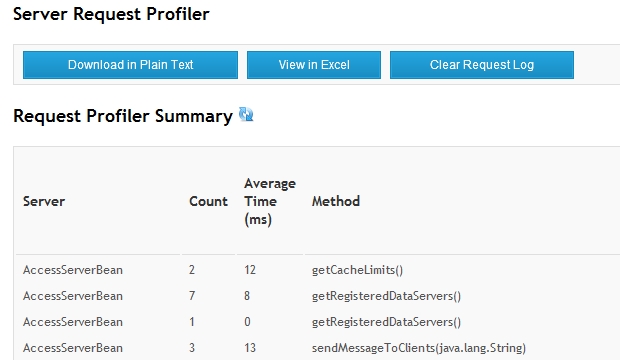
4.1 Request
This window allows viewing and downloading profiler information on the server.
| » | Click |
You can click Download in Plain Text to download a plain-text version of the Profiler log.
You can click View in Excel to download a CSV version of the Profiler log.
You can click Clear Request Log to clear the current information from the Profiler log.
4.2 SQL
This window allows viewing and downloading SQL profiling information on the server.
Ⓘ [NOTE: SQL monitoring consumes considerable resources and should only be used to diagnose database issues]
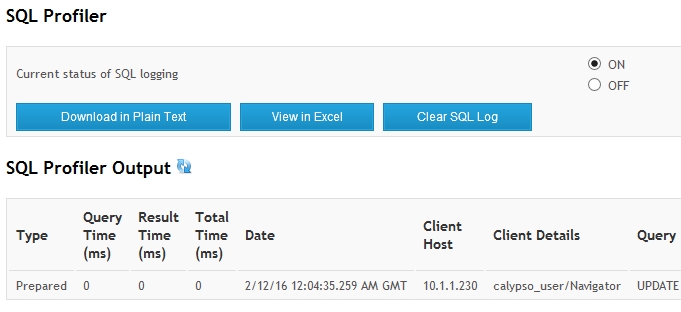
| » | Check "ON" to enable SQL profiling, or "OFF" to disable SQL profiling. |
| » | Click |
You can click Download in Plain Text to download a plain-text version of the Profiler log.
You can click View in Excel to download a CSV version of the Profiler log.
You can click Clear Request Log to clear the current information from the Profiler log.
5. Monitoring Menu
The menu items of the Monitoring menu are described below.
5.1 Alerts
See Alerts for details.
5.2 Clients
This window allows monitoring all connected clients.
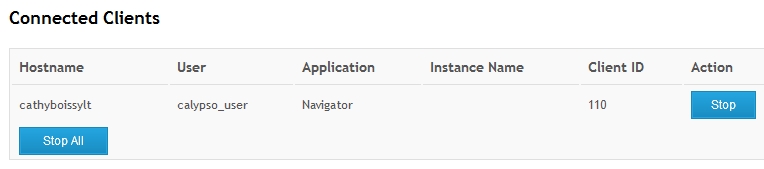
You can click Stop for a given client to disconnect the client.
You can click Stop All to disconnect all clients.
5.3 Servers
This window shows all registered servers.
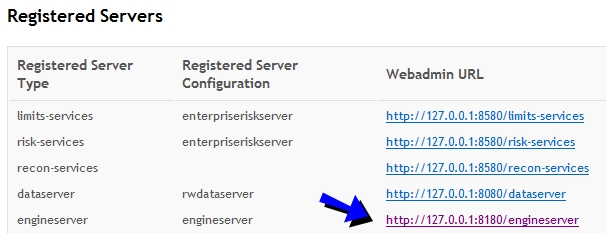
You can click a "Webadmin URL" to bring up the Web Admin application for the corresponding server.
5.4 SQL Statements
This window allows viewing and monitoring database connections and statistics.
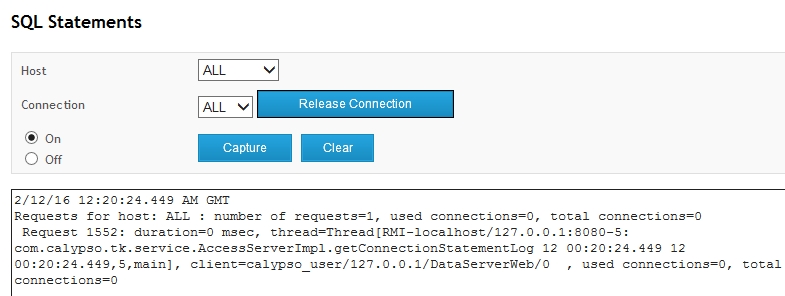
| » | Check "On" to enable SQL statements monitoring for the selected Host/Connection combination, or "Off" to disable SQL statements monitoring. |
| » | Click Capture to monitor SQL statements. |
You can also set the environment property KEEP_CONNECTION_STACK_TRACE=Y to trace the database connections by default.
Only SQL statements that take an extended time appear in this panel. If a given SQL statement takes too long and impacts the performance of the system, it can indicate an index missing in the database schema, an improperly configured query, or database tables that should be archived to remove unused data.
It can also indicate a defective application, in which case you need to kill the corresponding process: select the connection that initiated the request from the Connections field and click Release Connection to stop it.
You can click Clear to clear the SQL statements monitoring.
6. Logs Menu
The Logs menu brings up the Server Logs window that allows configuring logging levels and viewing log files.
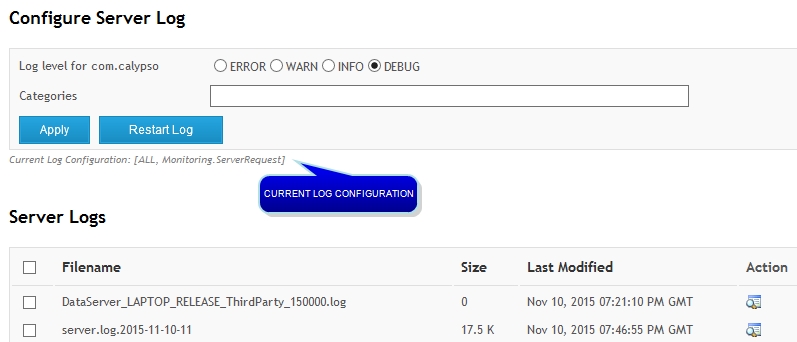
6.1 Configuring Server Logs
| » | Enter the fields as needed in the Configure Server Log area, and click Restart Log to change the log settings. The fields are described below. |
| Fields | Description | ||||||||||||
|
Log Levels |
|
||||||||||||
|
Categories |
Begin typing to select a Category from the dropdown selector, and click Apply. The category is added to the log configuration. If you select another category, click Apply again to add it. For example: Current Log Configuration: [DEBUG, MATCHING] To clear the default log configuration, leave the Categories field empty, and click Apply. It will only show the log level. You can exclude certain log categories when the log category is set to ALL by prefixing a category with "–" as shown in the example below: Current Log Configuration: [DEBUG, ALL, -MATCHING] |
6.2 Viewing Server Logs
In the Server Logs area, you can select a log file and click ![]() to view its details.
to view its details.
You can select multiple log files and click Download to download the log(s) and a text file containing diagnostic information for your Calypso implementation. The name of the zip-compressed file that contains the log(s) and diagnostic information file is: calypso-server-logs-yyyy-MM-DD-HH-MM-SS.zip.
You can click Calypso Diagnostic Information to display diagnostic information - It shows the settings for the following type of information:
| • | Data Server Options |
| • | Engine Parameters |
| • | Event Configuration |
| • | Environment Properties |
| • | JVM/Java System Properties |
See Generating and Viewing Error Logs for more information on error logging.