Health Check
Evaluating the health of an application means evaluating the health of various features, and aggregating these local evaluations into a process health evaluation. The Health Check feature checks for things such as:
| • | the engine server CPU and memory consumption are within reasonable ranges |
| • | there is a running connection to the Data Server |
| • | there is a running connection to the database |
Should one of these critical resources be down, the server can be considered to be in a critical state.
This extensible and configurable framework supplies a HTTP REST API which allows for the implementation of Kubernetes sensors as well as an external monitoring tool to request the health of a Calypso server.
The REST API is available on all Calypso servers.
1. Health Check Layout
The Health Check framework considers each server as a collection of sub systems (like System, Calypso or Engines that are configured to run on the server). Each sub system maintains a collection of health check sensors, such as memory usage, unconsumed events, etc....
Upon reception of a health request, the framework cascades the request down to each love sub-system and then down to each sensor handled by the sub-system.
Each sensor evaluates its health and returns its health status through an object carrying a state (Green, Amber or Red) and some additional details.
Each sub-system aggregates its sensors' health and computes its state accordingly. The framework aggregates sub-systems' health and computes the overall health state.
The table below gives examples of sub-subsystems and related sensors:
|
Sub-System Samples |
Available Sensors |
|||||||||
|---|---|---|---|---|---|---|---|---|---|---|
|
|
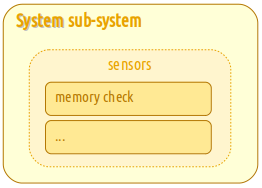
The System sub-system could have:
Presently, the System only supplies the memory usage sensor. |
|||||||||
|
|
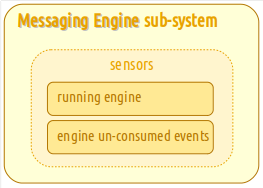
Engine sub-systems have:
|
1.1 Sensor Health Check
Each sensor evaluates its health by computing a metric value that it compares with an amber and/or a red threshold. At least one of the two thresholds must not be null.
| • | If the metric value hits the red threshold, the sensor will return a health object whose state is red. |
| • | If the metric value hits the amber threshold, the sensor returns an object whose state is amber. |
| • | Otherwise, the sensor returns a health object whose state is green. |
1.2 Sub-System Health Check
Once the health of the children sensors are collected, the sub-system computes its health through the following algorithm:
| • | If a critical sensor has a red state, the sub-system state is red. |
| • | If a non-critical sensor has a red state or if a critical sensor has an amber state, the sub-system state is amber. |
| • | Otherwise, the sub-system state is green. |
1.3 Process Health Check
The same framework that applies for sub-system health check applies for process health check.
| • | If a critical sub-system has a red state, the process state is red. |
| • | If a non-critical sub-system has a red state or if a critical sub-system has an amber state, the process health state is amber. |
| • | Otherwise, the process health state is green. |
1.4 Format of Health Check Response
After defining sub-systems and sensors, it is possible to detail the structure of the health check response.
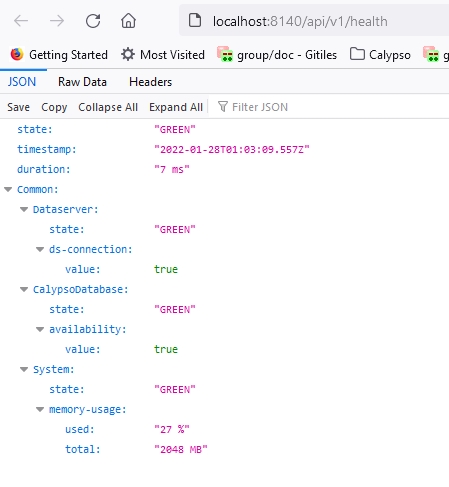
This response provides a http status code and a JSON http response body. The JSON body provides:
| • | a state field |
| • | a timestamp field - gives the timestamp in UTC format, captured at the end of the query processing |
| • | a duration field - gives the number in milliseconds required for processing the query |
| • | additional sections supplying indications about the various sub-systems' health. |
Some sub-systems being shared by all the processes are displayed in the Common section of the response, which comes first. This way, the first items of the response are the same whatever the query process.
Engine Server Health Check
1.5 Authentication
The API is exposed as a REST service and all calls to the API are secured with Calypso Application Server authentication.
A provision has been made to enable or disable authentication for REST API. Users who do now want any authentication in the REST API can set the property DISABLE_HEALTHCHECK_AUTH=true in the user environment property file.
By default, authentication is enabled.
2. HTTP API
To perform a http health check request, you need to call a GET on the related web admin and /api/v1/health / and /actuator/health.
For example, on the Data Server:
% curl --user <user>:<password> --request GET http://localhost:8100/api/v1/health
or, if SSL is enabled:
% curl --insecure --user <user>:<password> --request GET https://localhost:8101/api/v1/health
The application will return a JSON formatted response with the following indications:
|
HTTP Code |
Health Check state field |
Description |
|---|---|---|
|
500 |
Red |
Unhealthy – Severe condition, component restart is required, memory consumption > 99%. For Kubernetes, the component might become eligible for an automatic restart. |
| 200 | Amber | Warning - component is reporting a kind of failure that suggests admin take a look, but server restart not necessarily needed, memory consumption >90%, network latency with dataserver >1ms (or whatever is the least required latency). |
| 200 | Green |
Healthy |
3. API Specification
All resources are append with /api/v1/health/, such as:
http://<host>:<port>/api/v1/health
For example:
| • | Data Server health URL: http://localhost:8100/api/v1/health |
| • | Engine Server health URL: : http://localhost:8140/api/v1/health |
The following URI is exposed:
-
Retrieving the health status of the Engine Server
| Resource | |
|
HTTP Method |
GET |
| Input |
N/A |
|
Optional Query Parameters |
N/A |
|
Output |
JSON Object representing health of server, comprising of:
|
|
Description |
Retrieves health of Engine Server |
|
Sample Invocation |
Engine Server health URL: |
|
Sample Request |
curl --user calypso_user:calypso --request GET http://localhost:8140/api/v1/health |
|
Sample Output |
{ "state": "AMBER", "timestamp": "2020-11-19T07:41:27.921Z", "duration": "243 ms", "Common": { "Dataserver": { "state": "GREEN", "ds-connection": { "value": true } }, "CalypsoDatabase": { "state": "GREEN", "availability": { "value": true } }, "System": { "state": "GREEN", "memory-usage": { "used": "57 %", "total": "2048 MB"
} }, "EngineServer": { "AccountingEngine": { "state": "GREEN", "unconsumed-events": { "count": 0 }, "running": { "value": true } }, "CollateralManagementEngine": { "state": "GREEN", "unconsumed-events": { "count": 0 }, "running": { "value": true } }, "CreEngine": { "state": "GREEN", "unconsumed-events": { "count": 0 }, "running": { "value": true } }, "DiaryEngine": { "state": "GREEN", "unconsumed-events": { "count": 0 }, "running": { "value": true } }, "EcoHedgeEnrichmentEngine": { "state": "GREEN", "unconsumed-events": { "count": 1 }, "running": { "value": true } }, "FTPEngine": { "state": "GREEN", "unconsumed-events": { "count": 0 }, "running": { "value": true } }, "ImportMsg_DTCC_GTR": { "state": "AMBER", "unconsumed-events": { "count": 0 }, "running": { "state": "RED", "value": false } }, "IncomingEngine": { "state": "GREEN", "unconsumed-events": { "count": 0 }, "running": { "value": true\ } }, "InventoryEngine": { "state": "GREEN", "unconsumed-events": { "count": 0 }, "running": { "value": true } }, "LifeCycleEngine": { "state": "GREEN", "unconsumed-events": { "count": 0 }, "running": { "value": true } }, "LiquidationEngine": { "state": "GREEN", "unconsumed-events": { "count": 0 }, "running": { "value": true } }, "MarginCallPositionEngine": { "state": "GREEN", "unconsumed-events": { "count": 0 }, "running": { "value": true } }, "MarginController": { "state": "AMBER", "unconsumed-events": { "count": 0 }, "running": { "state": "RED", "value": false } }, "MatchableBuilderEngine": { "state": "GREEN", "unconsumed-events": { "count": 0 }, "running": { "value": true } }, "MatchingEngine": { "state": "GREEN", "unconsumed-events": { "count": 0 }, "running": { "value": true } }, "MessageEngine": { "state": "GREEN", "unconsumed-events": { "count": 0 }, "running": { "value": true } }, "PositionEngine": { "state": "GREEN", "unconsumed-events": { "count": 0 }, "running": { "value": true } }, "RelationshipManagerEngine": { "state": "GREEN", "unconsumed-events": { "count": 0 }, "running": { "value": true } }, "SftrEngine": { "state": "AMBER", "unconsumed-events": { "count": 0 }, "running": { "state": "RED", "value": false } }, "TaskEngine": { "state": "GREEN", "unconsumed-events": { "count": 0 }, "running": { "value": true } }, "TransferEngine": { "state": "GREEN", "unconsumed-events": { "count": 0 }, "running": { "value": true } }, "UpdateManagerEngine": { "state": "GREEN", "unconsumed-events": { "count": 0 }, "running": { "value": true } }, "EnginesMonitoring": { "state": "GREEN" } } } |
|
|
2. Retrieving the health status of the Data Server
| Resource | |
|
HTTP Method |
GET |
| Input |
N/A |
|
Optional Query Parameters |
N/A |
|
Output |
JSON Object representing health of server, comprising of:
|
|
Description |
Retrieves health of Data Server |
|
Sample Invocation |
Data Server health URL: |
|
Sample Request |
curl --user calypso_user:calypso --request GET http://localhost:8100/dataserver/api/v1/health |
|
Sample Output |
{ "state": "GREEN", "timestamp": "2020-11-19T07:37:41.479Z", "duration": "8 ms", "Common": { "CalypsoDatabase": { "state": "GREEN", "availability": { "value": true } }, "System": { "state": "GREEN", "memory-usage": { "used": "39 %", "total": "2048 MB" } } } } |
List of other servers exposing Health Check REST API:
|
Server Name |
Example URL |
|---|---|
|
Auth Server |
|
|
Event Server |
|
|
Risk Server |
|
| In Memory Risk Server | http://localhost:8500/api/v1/health |
|
CD ISDA Model Server |
|
|
Curve Server |
|
|
CBSL Server |
|
|
Position Keeping Server |
|
|
ERS Risk Server |
|
|
Analysis Server |
|
|
eDealing Server |
|
|
XVA Server |
|
|
ERS Limits Server |
|
|
Liquidity Server |
|
|
Calypso Services Interface Server |
|
|
Entitlement Server |
|
|
BO Report Server |
|
|
Calypso Services |
|
|
Calypso Services Collateral MS |
|
|
ERS Compliance Server |
|
|
Regulatory Risk Server |
|
|
Scheduler |
|
|
Calypso Messaging Server |
4. Environment Property
The property SERVER_STARTUP_RETRY_COUNT is used to set the retry count after which the server will stop trying to hit the health check URL. This parameter is configurable and can be increased and decreased as required. The default value is 20.