Detecting Operational Anomalies
As a general rule, when performance is deteriorating or when your system is running out of memory, restarting the Data Server should be the last resort.
| • | Check the indicators described below and attempt to remedy the anomalies using the available tools. |
| • | In general, first diagnose the client application using the tools provided in the client, to determine if the anomaly originates from the client. More tools are available in Web Admin to diagnose client applications, in particular with respect to database usage. |
If the anomaly comes from a client application, you can stop that client from Web Admin, if needed.
| • | If the anomaly does not come from the client application, you should then diagnose the servers and the engines using Web Admin. |
The tools for diagnosing applications allow detecting operational anomalies in the following areas:
| • | Client Performance |
| • | Memory |
| • | Risk Infrastructure |
| • | Database |
| • | Data Server Performance |
1. Client Performance
Tips for maximizing the performance of client applications:
| • | When loading trades, use trade filters with books specified as part of the selection criteria. Trades are cached by book in the Data Server and loading by book will cache the trades. This will result in much faster retrieval if someone else has already loaded the trade, or the next time you need the trade. |
| • | Task Station - Turn off the following options: Configure > Load Trades, Configure > Load Messages, Configure > Load Transfers. To load a trade, a message, or a transfer, double-click a task, and the corresponding trade, message, or transfer will be loaded individually. |
| • | For custom applications: |
| – | Use the local caches BOCache and LocalCache for retrieving static data, instead of accessing the Data Server directly. |
| – | Whenever possible, use bulk loading instead of loading items one at a time. |
| – | Consider implementing your own externalization instead of using Java’s default serialization. |
 Refer to the Calypso Developer’s Guide for details.
| • | To assist in understanding certain issues, a tracer can be placed to monitor Calypso caches. This tracer is disabled by default except when a variable enabling the tracer for the specific Calypso cache is given in the environment. |
The conditions for the cache monitoring to be activated are:
| – | The environment variable <cache_name> + .TRACE is set to true. |
For example, for BO Messaging, the environment variable is BOMessageSQL._cache.TRACE=true
| – | Log category com.calypso.tk.util.cache.CalypsoCacheTracer is enabled. |
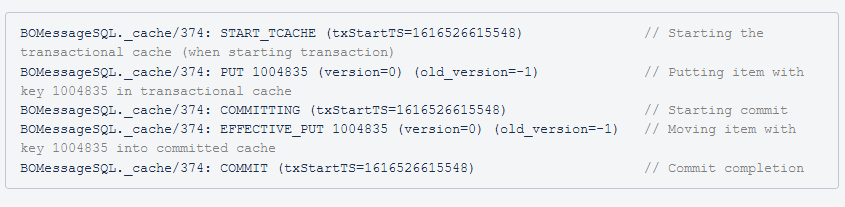
The traces have the following format:
| – | For global operations (start cache, committing, commit, rollback): <cache_name>/<requested>: <operation> (txStartTX=unix_timestamp) |
| – | For cache item operation (put, remove, eviction, etc…): <cache_name>/requested>: <Operation> item_key (version=x) (old_version=y) |
EXAMPLE
2. Memory Usage
You can check the memory using the following tools:
| • | Check the Data Server memory using Web Admin > Data Server > Server > Information. |
See Data Server Web Admin for details.
| • | Use Web Admin Alerts to monitor specific indicators. |
See Alerts for details.
To free the memory, you can:
| • | Call Garbage Collection multiple times using Utilities > Maintenance > Cache/Memory > Garbage Collection from the Calypso Navigator. |
| • | Check and release unused database connections using Web Admin > Data Server > Monitoring > SQL Statements. |
See Data Server Web Admin for details. Call Garbage Collection after this operation.
| • | Clear the caches, and lower the cache limits using Web Admin > Data Server > Metrics > Caches. |
See Data Server Web Admin for details.
| • | Allocate more memory to the application. The allocated memory for a given application is specified at startup. |
3. Risk Infrastructure
The Risk Server Web Admin provides monitoring capabilities for the Calculation Server and the Presentation Server.
See Risk Server Web Admin for details.
4. Database Performance
Check SQL Statements to identify queries that take too long to execute. You can monitor the SQL queries to diagnose the source of the anomaly using Web Admin > Data Server >Monitoring > SQL Statements.
It can indicate that an index is missing in the database schema, that a query is improperly configured, or that you should archive unused data from the database tables. If none of those conditions apply, it can indicate a defective application, in which case you must kill the corresponding process.
See Data Server Web Admin for details.
5. Tips for Improving Performance
Performance can be impacted by unconsumed events. You can use Web Admin > Data Server > Metrics > Pending Events to detect unconsumed events.
In general, to improve the performance of the system you should perform the recommended maintenance routine. Calypso offers a number of scheduled tasks to archive and delete unused objects.
See Recommended Maintenance Routine for details.
The following environment properties allow improving the performance of the Data Server:
Note:
| • | COMPRESS_RMI_PACKETS - True of False. Set to true to compress RMI packets sent and received, or False otherwise. Default is False. |
| • | DS_EVENT_BUFFER_POOL_MAX_SIZE — The events in the Event publisher queue are only published if the number of events does not exceed DS_EVENT_BUFFER_POOL_MAX_SIZE. |
If the number of events exceeds DS_EVENT_BUFFER_POOL_MAX_SIZE, they are not published.
This feature prevents the Data Server from blocking the Event Server. Events are not published to the Event Server by waiting for a handshake. Instead, a pool is set up to store the events, and a separate thread is used to process the events.
This number varies from installation to installation, and some adjustment will be necessary as the system is deployed. The initial value should be 10,000.
This feature is also available at the command line using the –eventbuffersize <size> option.
A number of engine parameters allow improving the performance of the engines.
Refer to Calypso Engine Parameters documentation for details.