Generating and Viewing Error Logs
When a problem is encountered or suspected, be sure to check your log files. In particular, always check the Server log (Data Server, Engine Server, and the Risk Server’s separate Calculation Server and Presentation Server logs) files in addition to the log file for the application you are trying to run.
Calypso’s logging system:
| • | Is based on a named category set |
| • | Has the following priority levels: DEBUG, INFO, WARN, ERROR, and FATAL |
| • | Is optimized for speed and is thread-safe |
| • | Is designed to handle Java Exceptions |
| • | Provides a GUI log viewer and filter |
| • | Logging is enabled by default for all Calypso processes (client and server) |
1. Navigator Launcher Tool
If you encounter an issue in the Calypso Navigator, you can use the Navigator Launcher tool to collect logs and statistics. It creates a ZIP file that contains the logs, thread dumps and heap dumps of the Calypso Navigator. You can use that ZIP file to report the issue.
Follow the steps below to obtain Calypso Navigator logs if you get an error in the Calypso Navigator:
Step 1 - If you get an error in the Calypso Navigator, run <calypso home>/deploy-local/<Environment>/<navigatorLauncher.bat.sh.
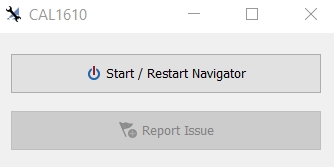
Step 2 - Click Start / Restart Navigator to restart the Calypso Navigator.
Try to reproduce the error.
Step 3 - If you are able to reproduce the error, click Report Issue.
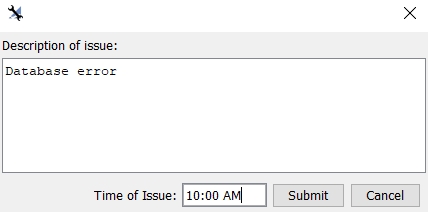
| » | Enter a description of the issue and the time when it occurred, and click Submit. |
The ZIP file is created by default under <user home>/Calypso/NavigatorLauncher-Report-<user name>-<date and time>.zip.
The description and time are saved to a readme file inside the ZIP file.
You can customize some parameters by adding the property file <user home>/Calypso/navigatorlauncher.properties.
| • | outputdir - Directory where report (zip) is saved |
| • | thread_dump_count - Number of thread dumps to capture (Default is 5) |
| • | thread_dump_interval - Delay between each thread dump in milliseconds (Default is 2000) |
Example:
outputdir=C:/reports/navigatorlauncher
thread_dump_count=10
thread_dump_interval=5000
2. Log Entry Format
Calypso log lines have the following format:
2015-01-23 10:23:27,864-0500 INFO [com.calypso.SYSTEM.TaskEnrichmentSQL] (ServerService Thread Pool -- 82) [10.0.33.39-calypso_user/DataServer] Registering 26 TaskEnrichment(s)
optionalThrowable stack trace ....
|
Item |
Definition |
|---|---|
|
2015-01-23 |
The date of the log entry: yyyy-MM-DD (ISO8601 format). The example entry is June 12, 2014. |
|
10:23:27,864-0500 INFO |
The time of the log entry: HH:MM:SS, ms-TIMEZONE (ISO8601 format). The example entry is 12:23:27 and 864 milliseconds (PM) in the -GMT -5 timezone. |
|
INFO |
The log priority level. |
|
[com.calypso.SYSTEM.TaskEnrichmentSQL] |
The offending class. |
|
(ServerService Thread Pool -- 82) |
The offending thread. |
|
[10.0.33.39-calypso_user/DataServer] |
The IP address, user name, and server associated with the entry. |
|
Registering 26 TaskEnrichment(s) |
The error message |
|
optionalThrowable stack trace .... |
An optional stack trace. |
3. Setting Logging Behavior, Levels, and Categories
Application Log statements are output to the log depending on their Level and Category. The application programmer uses Categories and Levels to maintain runtime control over which statements are printed. You can change the logging Levels and the Categories in the Environment.
It is recommended however to only change the logging Level and Category for investigation purposes only as it impacts the performance.
Logging Behavior
Modify the following environment properties to change logging behavior as desired:
| Property | Description |
|---|---|
| LOG_CATEGORY |
Comma-separated list of log categories. It is recommended to set to NONE by default. You can modify as needed for investigation purposes. |
| LOG_LEVEL |
Comma-separated list of log levels: DEBUG, INFO, WARN, ERROR, FATAL. It is recommended to set to ERROR by default. You can modify as needed for investigation purposes. |
|
LOG_MAXFILESIZE=nnn |
The size of the file in bytes (10000000 is 10MB) before it is backed up/rolled. Sizes below 10MB are not supported. |
|
LOG_MAXBACKUPINDEX=n |
The maximum number of back up files to retain. |
|
LOG_STACKTRACE_PRUNING |
Enables or disables the stack trace pruning feature. Set to true enables the pruning, false to disable the pruning. Default is to have the feature enabled.
|
Setting Logging Levels and Categories on-the-fly
You can also set the logging Levels and Categories on-the-fly using Web Admin > * > Logs
 See Data Server Web Admin for details.
For the Calypso Navigator, set the logging Levels and Categories on-the-fly using Utilities > Maintenance > Log > Configure Log.
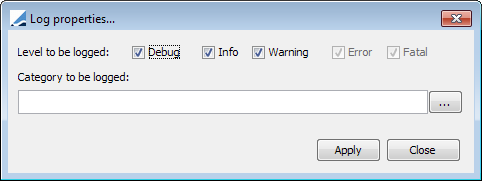
| » | The Logging Levels are selected using the checkboxes. |
| » | Click ... to select log categories. |
| » | Click Apply. |
CalypsoRewriteAppender
This custom appender will has
| • | a resetLevel attribute providing the full name of a class that should implement CalypsoResetLogEventLevelRule |
| • | a to attribute providing the reference of another appender to which logging events will be redirected |
The reset log event rule takes 2 parameters: the log level and the unformatted message of the same logging event and must returns another log level. With this new log level, the rewrite appender will forge a new logging event that will be redirected to the "embedded" appender.
4. Log Aggregation
Log aggregation is a feature provided by the calypso-logging library. The main idea is to aggregate repeated messages to avoid cluttering calypso logs with noisy information that might hide important logging.
With this feature, calypso ensures that repeated logging events are published only once out of every X times, with X being a configurable parameter named the aggregation factor.
The feature is activated by default. But it can be deactivated or modified through the specific configuration file calypso-logging.xml. When starting up, the feature creates an internal guava cache that tracks logging events repetition over a configurable period of time.
To reduce the memory and CPU footprint, this internal cache:
| • | is bound in capacity (through a configurable parameter) |
| • | combines 2 eviction strategies provided by guava caches: |
| – | age eviction: the least updated entries are evicted first |
| – | size eviction: which grants that the cache will never exceeds the given capacity limit |
4.1 Behavior of the Log Aggregation
The first time a logging event is effectively published, the logging aggregation feature starts tracking potential repetition of the same. Subsequent repetitions will be retained in the cache until one of the 2 following thresholds is hit:
| • | a count threshold: the number of retained occurrences reaches the given aggregation factor. |
In that case, the logging event is effectively published and we indicate the number of dropped logging events since the last publication.
| • | a timeout threshold: the retention time reaches the cache timeout. |
In that case the logging event becomes eligible for being published. It will be published the next time a clean-up task wakes up and forces its publication.
4.2 Setting up the Log Aggregation Feature
The log aggregation feature is activated by default with the fall-back values given below. Its configuration can be customized using the resource file calypso‑logging.xml in the classpath.
Setup Structure
The configuration file has the following structure:
<calypso-logging>
<aggregation>
<!-- enabling the feature -->
<enabled>true</enabled>
<!-- bounding internal cache 10000 entries -->
<cache-capacity>10000</cache-capacity>
<!-- Setting the timeout to 1 minute -->
<timeout units="minutes">1</timeout>
<!-- Setting the aggregation factor to 100 -->
<factor>100</factor>
</aggregation>
</calypso-logging>
The parameters driving the feature are the following:
|
enabled |
Indicates whether the log aggregation is activated or not. By default, the log aggregation is activated. Setting this parameter to false disables the log aggregation. |
|
cache-capacity |
The max capacity of the internal cache used for monitoring the logging event hits. The minimal value is 100, no maximal value. The default value is 10000. |
|
timeout |
The aggregation timeout (the units can be milliseconds, seconds or minutes, as per the same-name attribute). When a retained logging event message has been held in cache longer than the aggregation timeout, it becomes available for being flushed and effectively published. The minimal value is 100 milliseconds, no maximal value. The default value is 2 minutes. |
|
factor |
Defines the aggregation ratio. When aggregating a logging event, we effectively log one occurrence out of every factor occurrences. The minimal value is 2, no maximal value. The default is 100. |
Disabling Log Aggregation
You need to provide a file named calypso‑logging.xml in the classpath that contains:
<calypso-logging>
<aggregation>
<!-- disabling the feature -->
<enabled>false</enabled>
</aggregation>
</calypso-logging>
It is also possible to enable or disable the feature for a complete Calypso environment by providing the LOG_AGGREGATION environment property.
When LOG_AGGREGATION is set to false, the log aggregation is disabled.
When LOG_AGGREGATION is set to true, the log aggregation is enabled. The default is true if the property is not set.
4.3 Enriching Log Output with Log Aggregation Information
The number of occurrences dropped between 2 identical log entries is supplied through the MDC property Aggregation. You can have it published by adding %X{Aggregation} in appenders layout.
Calypso appenders are configured to place that information with the following format [%X{Aggregation}] at the end of the log message header, so just before the logging entry body (format %m).
A non aggregated log entry will look like
2019-06-11 10:18:41,344+0200 INFO [com.calypso.SYSTEM.CalypsoDBAlertsTimer] (EJB default - 4) [-] [] CalypsoDBAlertsTimer checking for database level alerts
A sampled log entry will look like
2019-06-11 10:18:41,344+0200 INFO [com.calypso.SYSTEM.CalypsoDBAlertsTimer] (EJB default - 4) [-] [AggCount:10] CalypsoDBAlertsTimer checking for database level alerts
The aggregation count information has been highlighted. The above example indicates that the corresponding log entry has aggregated 10 identical logging events.
Let's dig a little bit deeper on the full mechanism.
Below is an example of what would be a repeated logged message (15 times) without the logging aggregation feature:
2019-12-02 18:01:07 INFO com.calypso.SYSTEM.CalypsoDBAlertsTimer (EJB default - 4) [] CalypsoDBAlertsTimer checking for database level alerts
2019-12-02 18:01:12 INFO com.calypso.SYSTEM.CalypsoDBAlertsTimer (EJB default - 4) [] CalypsoDBAlertsTimer checking for database level alerts
2019-12-02 18:01:17 INFO com.calypso.SYSTEM.CalypsoDBAlertsTimer (EJB default - 4) [] CalypsoDBAlertsTimer checking for database level alerts
2019-12-02 18:01:22 INFO com.calypso.SYSTEM.CalypsoDBAlertsTimer (EJB default - 4) [] CalypsoDBAlertsTimer checking for database level alerts
2019-12-02 18:01:27 INFO com.calypso.SYSTEM.CalypsoDBAlertsTimer (EJB default - 4) [] CalypsoDBAlertsTimer checking for database level alerts
2019-12-02 18:01:32 INFO com.calypso.SYSTEM.CalypsoDBAlertsTimer (EJB default - 4) [] CalypsoDBAlertsTimer checking for database level alerts
2019-12-02 18:01:37 INFO com.calypso.SYSTEM.CalypsoDBAlertsTimer (EJB default - 4) [] CalypsoDBAlertsTimer checking for database level alerts
2019-12-02 18:01:42 INFO com.calypso.SYSTEM.CalypsoDBAlertsTimer (EJB default - 4) [] CalypsoDBAlertsTimer checking for database level alerts
2019-12-02 18:01:47 INFO com.calypso.SYSTEM.CalypsoDBAlertsTimer (EJB default - 4) [] CalypsoDBAlertsTimer checking for database level alerts
2019-12-02 18:01:52 INFO com.calypso.SYSTEM.CalypsoDBAlertsTimer (EJB default - 4) [] CalypsoDBAlertsTimer checking for database level alerts
2019-12-02 18:01:57 INFO com.calypso.SYSTEM.CalypsoDBAlertsTimer (EJB default - 4) [] CalypsoDBAlertsTimer checking for database level alerts
2019-12-02 18:02:02 INFO com.calypso.SYSTEM.CalypsoDBAlertsTimer (EJB default - 4) [] CalypsoDBAlertsTimer checking for database level alerts
2019-12-02 18:02:07 INFO com.calypso.SYSTEM.CalypsoDBAlertsTimer (EJB default - 4) [] CalypsoDBAlertsTimer checking for database level alerts
2019-12-02 18:02:12 INFO com.calypso.SYSTEM.CalypsoDBAlertsTimer (EJB default - 4) [] CalypsoDBAlertsTimer checking for database level alerts
2019-12-02 18:02:17 INFO com.calypso.SYSTEM.CalypsoDBAlertsTimer (EJB default - 4) [] CalypsoDBAlertsTimer checking for database level alerts
Now, here is what it becomes with an aggregation factor set to 10:
2019-12-02 18:01:07 INFO com.calypso.SYSTEM.CalypsoDBAlertsTimer (EJB default - 4) [] CalypsoDBAlertsTimer checking for database level alerts
2019-12-02 18:01:57 INFO com.calypso.SYSTEM.CalypsoDBAlertsTimer (EJB default - 4) [AggCount:10] CalypsoDBAlertsTimer checking for database level alerts
2019-12-02 18:03:10 INFO com.calypso.SYSTEM.SomeClass (main) [] blah blah blah
2019-12-02 18:02:17 INFO com.calypso.SYSTEM.CalypsoDBAlertsTimer (LoggingHitCacheTimer) [AggCount:10] CalypsoDBAlertsTimer checking for database level alerts
The first occurrence starts the repetition tracking.
Then the 9 following occurrences of the same logging event are retained.
When the 11th occurrence is logged, we hit the threshold of 10 events in cache, we publish the corresponding occurrence and indicate that 9 logging events have been aggregated.
Afterwards, we retain in cache the 5 next occurrences of the logging event but never hit the count threshold. Without the timeout threshold, the logging events could be retained for ever.
Eventually the timeout expires. When the cleanup task wakes up, the last occurrence is published.
Please note that the timestamp 2019-12-02 18:02:17 is the timestamp of the 15th logging event creation, not its effective publication timestamp which happens after 2019-12-02 18:03:10.
We considered important to keep this timestamp at the cost of some ordering of the provided timestamps.
4.4 Stack Trace Pruning
Many logged exceptions can clutter logs with large stack traces that can mask the more useful information in the log.
The log parameter forced-visibility-depth can be used in conjunction with a blacklist of packages whose exceptions will be suppressed in the log. When removing several stack-trace items, they are replaced by ...suppressed n lines.
The first item of the stack trace block is visible irrespective of their package so that the root cause of an issue can be pin pointed. The number of items kept visible is determined by the forced-visibility-depth parameter.
4.4.1 Stack Trace Pruning Configuration
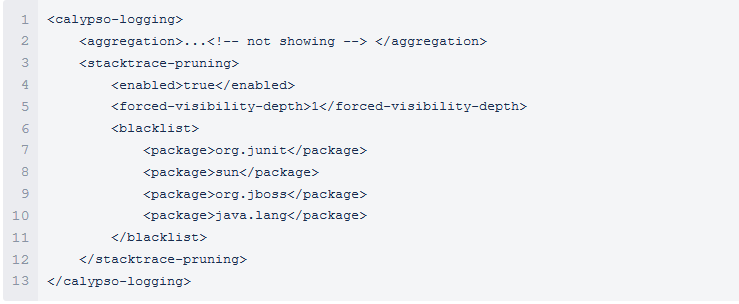
By default this feature is enabled with a forced-visiblity-depth of 1 and the following pre-defined blacklist:
org.sun, java
The settings can be modified using the calypso-logging.xml file in the classpath. This configuration file is used for log aggregation but can be also used for the stack-trace-pruning feature.
Below is a sample of the file:
This feature can be enabled or disabled as well using the Calypso environment property LOG_STACKTRACE_PRUNING.
Note: The environment property takes precedence over the enabled setting in calypso-logging.xml.
The following parameters are available for this feature:
|
Location |
Parameter |
Description |
|---|---|---|
|
calypso-logging.xml |
enabled |
The content of this node enables or disables the feature. Allowed values:
|
|
calypso-logging.xml |
forced-visiblity-depth |
The contents of this node is a positive integer. It provides the number of items in a stack-trace block that are visible, regardless of package. Allowed values:
|
|
calypso-logging.xml |
blacklist |
This node provides a blacklist of packages that the user does not want to see. |
|
User Environment Properties file |
LOG_STACKTRACE_PRUNING |
This boolean property can enable or disable the stack-trace pruning feature. It takes precedence over enabled in calypso-logging.xml. |
5. Application Logs
By default, Calypso Client Application logs are found in the <user home>\Calypso directory.
Server log files are also found in the <user_home>\Calypso directory.
Two environment properties can enable extended application naming for server logs, calypso.appname.prefix and calypso.appname.suffix. These properties allow for extended application names by linking together calypso.appname.prefix + calypso.appname + calypso.appname.suffix. If these properties are not given (default behavior) there is no extended application name. If the properties are given, the extended application name is reflected in the generated log files.
For example, if a customer launches servers with the parameter -Dcalypso.appname.prefix=TK, the Calypso log files will all be prefixed with TK, such as TK_DataServer_LOG161_161066.log.
A column header name appears at the top of each log. Each column is separated by the pipe symbol (|).
Ⓘ [NOTE: Runtime arguments can change the location and name of log files]
5.1 Event Log
Event logs contain details on all events passing through the system. Each event is a single entry having the following information:
| S.No | Information | Description |
|
1 |
CURRENT TIME IN MILLIS |
Current time in milliseconds. |
|
2 |
EVENT OCCURED TIME |
Time the event occurred. |
|
3 |
EVENT ID |
Event ID. |
|
4 |
EVENT CLASS NAME |
Event Class Name. |
|
5 |
EVENT DESC |
Event Description. |
5.2 Request Logs
Calypso enables Server Request Logs by default and makes an entry each time the system generates an applicable Alert.
Server Request Logs are generated when the request is completed. Incoming Server Request Logs provide the ability to track the call that caused the failure.
Clients can enable/disable Request logging via the Logging Categories window using the following categories:
| Logging Category | Description |
|---|---|
|
Monitoring.ClientRequest |
Add this category to enable Client Request logging. When a Client Request generates a stack trace, that stack trace is included with the log entry. |
|
Monitoring.ServerRequest |
Add this category to enable Server Request logging. To disable Monitoring.ServerRequest, set environment property MONITORING_LOGS=false. It is true by default. |
Server-Side Request Logs
Server-Side Request Logs (e.g., <AppName>_<CalypsoEnvName>_REQUEST_<calypsoVersion>.log) and Incoming Server Request logs (<AppName>_<CalypsoEnvName>_INCOMING_SERVER_REQUEST_<calypsoVersion>.log) contain the following items:
| Column Name | Description |
|---|---|
|
REQUEST_START_TIME |
The start time (in seconds since EPOC UTC) when the request was received. |
|
RESPONSE_TIME |
The total time it took to produce and begin sending the response to the client. Ⓘ [NOTE: this may not include serialization time between the server and client including any logic implemented in the objects writeExternal method] |
|
SQL_TIME |
The total time spent waiting for Oracle to execute queries for this request. This will be the sum of execute time for all queries associated with the request. |
|
NUM_OF_QUERIES_EXECUTED |
Number of queries executed during the request. |
|
NUM_OF_ROWS_READ |
Total number of rows read during the request. |
|
RESULTSET_OPEN_TIME |
Total amount of time spent in open result sets. |
|
BEGIN_FREE_MEMORY |
Free memory in the JVM at the time the request was received. |
|
END_FREE_MEMORY |
Free memory in the JVM at the time the response started to be sent. |
|
TOTAL_MEMORY |
Total configured memory of the JVM. |
|
WORKFLOW_TIME |
Total time spent in executing all the Workflow rules. |
|
EVENTS |
Total number of events generated during this request, to be published after the request is completed. |
|
USED_JDBC_CONNECTIONS |
Number of JDBC connections that were currently actively being used at the time of the request. |
|
AVAILABLE_JDBC_CONNECTIONS |
Number of JDBC connections that are available to be used for new requests. |
|
CLIENT_HOST |
Description of the client host making this request. |
|
CLIENT_DESCRIPTION |
Description of the client making this request. |
|
REQUEST_ID |
Unique integer id for this request, used to correlate this request line with SQL/WF drill down logging. |
|
SERVER_NAME |
Name of the service being invoked. |
|
METHOD_NAME |
Description of the method being invoked. |
|
INVOCATIONDEPTH |
A counter handling the request and sub-request within the same RMI call. Used when multiple entries are logged with the same request Id. |
Sample Log Lines
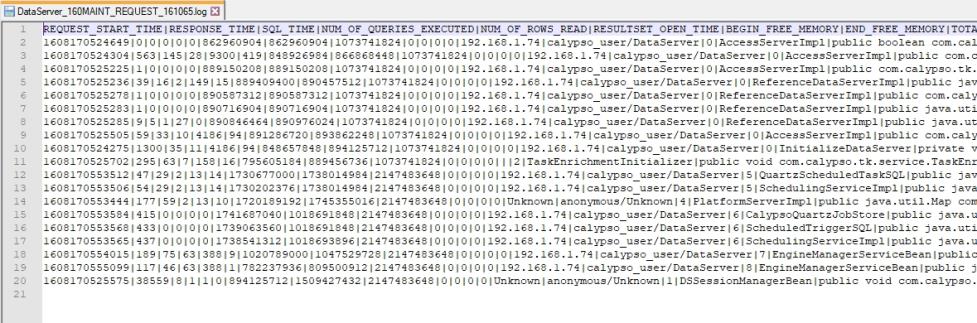
Server Request log
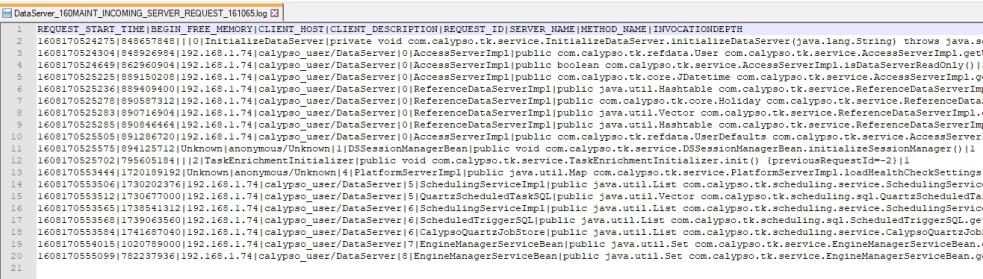
Incoming Server Request log
The two logs can be used together can help to find the inflight request that may have caused the server to fail.
Compare Utility to find InFlightRequest
1. Copy the Server Request and Incoming Server Request logs to <Calypso_Home>/client/resources/samples/Compare.
2. Run the compare.sh file
3. InCompleteRequests.txt file will generate with the crashed requests.
Client-Side Request Log
Client-side requests log the following items:
| S.No | Information | Description |
|
1 |
REQUEST_TIME |
Time request was sent to the server. |
|
2 |
RESPONSE_TIME |
Time taken to receive the response from the server. |
|
3 |
REQUEST_BEGIN_FREE_MEMORY |
Free Memory available at the start of the request. |
|
4 |
REQUEST_END_FREE_MEMORY |
Free Memory available at the End of the request. |
|
5 |
TOTAL_MEMORY |
Total memory available. |
|
6 |
METHOD_NAME |
Name of the remote method that is accessed. |
5.3 SQL Log
The SQL Log records all SQL activity and may be controlled at anytime. This log is controlled by a toggle and threshold on execute time. All values above the execute threshold are logged. If the threshold is set to 0, all SQL statements are logged.
| S.No | Information | Description |
|
1 |
START_TIME |
SQL Execution start time in milliseconds. |
|
2 |
EXECUTE_TIME |
Time taken to execute the SQL in milliseconds. |
|
3 |
LOG_CATEGORY |
Logging category, Possible values are: Monitoring.Sql.Execute.Statement Monitoring.Sql.Execute.PreparedStatement Monitoring.Sql.Execute.Callable |
|
4 |
NUM_OF_ROWS_READ |
No of rows read if this statement is a query. |
|
5 |
RESULTSET_OPEN_TIME |
Total time result set was open in milliseconds. |
|
6 |
RESULTSET_CREATE_TIME |
Time the result set was created in milliseconds. |
|
7 |
RESULTSET_LAST_FETCH_TIME |
The time when the result set next was called before the log statement(close of the resultset). |
|
8 |
CLIENT_HOST |
Host of the client that made this request when available. |
|
9 |
CLIENT_DESCRIPTION |
Description of the client that made this request when available. |
|
10 |
REQUEST_ID |
Unique request id(Unique for the time the servers session) that is generated for this request. |
|
11 |
SQL_STATEMENT |
The sql statement executed. |
|
12 |
IMMUTABLE_UPDATE |
Added immutable checks for some setters that will not interrupt the process but will log exceptions with category IMMUTABLE_UPDATE and WARN level. When such exception is encountered, please raise a case so that the issue can be further investigated. |
5.4 Workflow Log
The Workflow Log records all the workflow rules run for this request.
| S.No | Information | Description |
|
1 |
START_TIME |
Start time of the execution of the rule. |
|
2 |
RULE_EXECUTION_TIME |
Time spent executing the work flow rule. |
|
3 |
WORKFLOW_NAME |
Name of the workflow. |
|
4 |
WORKFLOW_RULE_CLASS_NAME |
Class of the Workflow Rule. |
|
5 |
WORKFLOW_CLASSNAME |
Class of the Workflow. |
|
6 |
WORKFLOW_ID |
Workflow Item Id: Trade Id for trade workflow, Transfer Id for Transfer workflow, etc. |
|
7 |
LOG_CATEGORY |
Logging category possible values are: Monitoring.WorkFlow Monitoring.Workflow.Trade Monitoring.Workflow.Trade.Update Monitoring.Workflow.Transfer.Check Monitoring.Workflow.Message Monitoring.Workflow.Message.Check Monitoring.Workflow.Message.Update Monitoring.Workflow.Entity Monitoring.Workflow.Entity.Check Monitoring.Workflow.Entity.Update |
5.5 Engine Log
The Engine Log provide event timing details for the engines.
| S.No | Information | Description |
|
1 |
START_TIME |
Start time of the execution engine process for the event. |
|
2 |
EXECUTION_TIME |
Time spent executing the engine process for the event. |
|
3 |
EVENT_ID |
The id of the event received. |
|
4 |
EVENT_DESCRIPTION |
Description of the event. |
|
5 |
LOG_CATEGORY |
Logging category, possible values are: Monitoring.Engine.Process |
6. Risk Infrastructure Monitoring Logs
Risk Infrastructure performance logging is available from the following servers/clients:
Calculation Server
CalculationServer_ENV_VERSION.log
Presentation ServerPresentationServer_ENV_VERSION.log
6.1 Calculation Server Log
The times in all columns are specified in milliseconds.
| • | Log Categories: |
Monitoring.CalculationServer.Run
The following information is logged in the sequence given:
| Log Column | Description |
|---|---|
| EVENTOCCUREDTIME | The time at which event took place. |
| RESPONSETIME | The time required to process the event. |
| SOURCE | The source that triggered this event, which is one of the following:INITIAL_RUN_AD_HOCINITIAL_RUN_COLD_STARTINITIAL_RUN_WARM_STARTTRADE_UPDATEMARKET_DATA_UPDATE |
| NEWTRADECOUNT | The number of new trades in this run. |
| MODTRADECOUNT | The number of modified trades in this run. |
| REMTRADECOUNT | The number of removed trades in this run. |
| JOBSCOUNT | The number of jobs produced. One, if not using calculators. |
| ROWSCOUNT | The number of rows saved into database. |
| TRADELOADINGTIME | The time taken to load trades (only during initial run). |
| BUILDMKTDATADEPENDENCIESTIME | The time required to build market data dependencies (only during the initial run). |
| GENERATEHEADERTIME | The time required to generate the header (only during initial run). |
| CREATEDATASTORETIME | The time required to create data stores and tables (only during initial run). |
| ANALYSISRUNTIME | The time required to run the analysis. |
| ANALYSISRESULTTRANSLATIONTIME | The time required to translate analysis output into rows to be saved into the database. |
| SAVERESULTSTIME | The time required to save the results into the database. |
| MARKCOMPLETIONTIME | The time taken to mark the run complete, which includes marking rows to be visible for users and deleting old rows. |
| SERVICEID | The unique service ID of this run. |
| SERVICEDESC | A service description, which includes the trade filter name, analysis name, etc. |
| CLIENTDESC | The requester of this service. |
| BEGINFREEMEMORY | Memory before the run. |
| ENDFREEMEMORY | Memory after the run. |
| TOTALMEMORY | Total memory. |
Sample Calculation Server Log Entry
1281051325562|54313|INITIAL_RUN_COLD_START|2|-1|
-1|1|2|4407|0|156|5797|25110|16|141|1000|calc-server-1 1 1281051325421|Composite/2601/default/pricing1/calc-server-1/null/1/-1/-1|[calypso_user/hninaunglt:1349/PresentationServer]|8046256|6550944|29798400|Initialization Done
6.2 Troubleshooting Log Errors
Error while creating table for analysis
Caused by: java.sql.SQLSyntaxErrorException: ORA-00955: name is already used by an existing object
Problem
Risk Infrastructure creates tables and views on the fly when attempting to save analysis results. The table name is usually cs_xxx. When attempting to create a new table, a table or view having the same name exists and was not cleaned up (i.e., deleted) during a prior run.
Solution
The following solutions are listed in the order of their suitability. Note that option three is offered as a last resort and should be used with extreme caution as changing table seeds may have unforeseen consequences.
| • | Drop and recreate your new Risk Infrastructure database and run Execute SQL again for the Risk Infrastructure database. |
| • | Clean up your Risk Infrastructure database. Delete all tables and views that are cs_xxx or delete_xxx. |
| • | Run the following SQL against the Risk Infrastructure database: |
update middletier_seed set last_id=yyyy where seed_name='TableSeed';"
Where yyyy must be a number that is greater than any table number in Risk Infrastructure . For example, if your Risk Infrastructure database has a table named cs_5000_xxxx, then, set yyyy=5001.
Prevention
Always manually unload a risk report before shutting down the Risk Infrastructure system.
Could not load analyses-persistence.properties
Caused by: java.lang.RuntimeException: Could not load analyses-persistence.properties
Problem
analyses-persistence.properties is required to launch the Risk Infrastructure . The file cannot be located.
Solution
| • | Place analyses-persistence.properties in <calypso home>/resources. |
Prevention
Ensure that analyses-persistence.properties is in <calypso home>/resources.
Middle Tier DB may not be hosted on Calypso core database
java.lang.RuntimeException: Middle Tier DB may not be hosted on Calypso core database
Problem
Risk Infrastructure requires its own dedicated database. This database cannot be the same as the Core Calypso database. There are two possible causes for this error:
| • | The Risk Infrastructure Database settings in your Environment are pointing to your Core Calypso database. |
| • | Make sure that you have run Execute SQL for the Risk Infrastructure database. |
Solution
| • | Verify that the Risk Infrastructure Database settings in you Environment match the parameters for your Risk Infrastructure database. |
| • | Drop all tables in the Risk Infrastructure database, then run Execute SQL for Risk Infrastructure database. |
Prevention
Make sure that you have run Execute SQL for the Risk Infrastructure database, and that the Risk Infrastructure database settings are correctly pointing to your Risk Infrastructure database.
Invalid config name
Time:02 Nov 2010 11:25:02,140 Level:ERROR Thread:main Host:-Category:com.calypso.ConfigRetriever
Message: Invalid config name=[MYCS]
Problem
You have either specified the wrong Calculation Server or Presentation-Server name, or one that does not exist.
Solution
Specify the correct Calculation Server or Presentation Server name.
| • | Verify the Calculation Server name in System > Calculation Server |
| • | Verify the Presentation Server name System > Presentation Server |
| • | Ensure that the configuration name you specify is correct and that they exist. |
Prevention
Correctly specify your Calculation Server and Presentation Server names.
Risk Infrastructure cannot connect to your database
org.hibernate.TransactionException: Transaction not successfully started
...
org.hibernate.exception.GenericJDBCException: Cannot open connection
...
Caused by: java.sql.SQLException: Connections could not be acquired from the underlying database!
...
Caused by: com.mchange.v2.resourcepool.CannotAcquireResourceException: A ResourcePool could not acquire a resource from its primary factory or source.
...
Problem
Risk Infrastructure cannot connect to your database. There are two probably causes:
| • | The Middle Tier Database properties in your Environment are incorrect. For example, the database password is incorrect, etc. |
| • | The RDBMS is not online. |
Solution
| • | Ensure that the Risk Infrastructure Database properties in your Environment are correct. |
| • | Ensure that the RDBMS is online. Either restart the RDBMS or, if it is hosted on a shared server, ask the DBA. |
Prevention
Verify that the Risk Infrastructure Database properties in your Environment are correct and that your database is online.
7. JMX Monitoring
Calypso supports the use of the Java Monitoring & Management Console (JConsole). By default, JMX Monitoring is enabled for all applications.
Use the following command line to launch the pre-configured JConsole. The invoking script file is pre-configured to attach to the Calypso Application Server $JAVA_HOME/bin/jconsole.
![]()
7.1 Using JConsole
Operation and analysis data from JConsole is beyond the scope of this document.
Please refer to JConsole -> Help > Online Help to view JConsole’s documentation (maintained by Oracle) or visit: http://docs.oracle.com/javase/7/docs/technotes/guides/management/jconsole.html.
7.2 Making a Connection from JConsole to Calypso
In JConsole, press CTRL+N or select Connection > New Connection... from the menu to open the New Connection window:
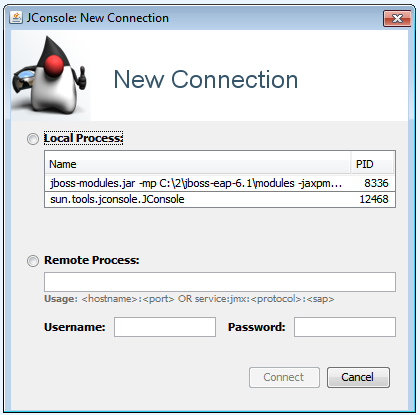
| » | Select the desired application and click Connect to open the Monitoring window. |
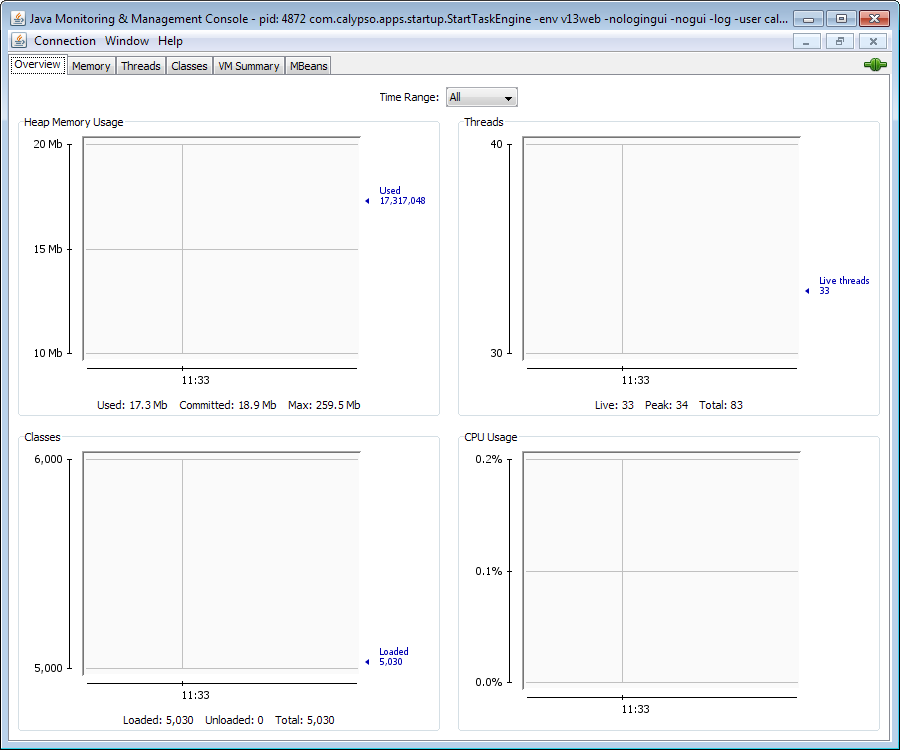
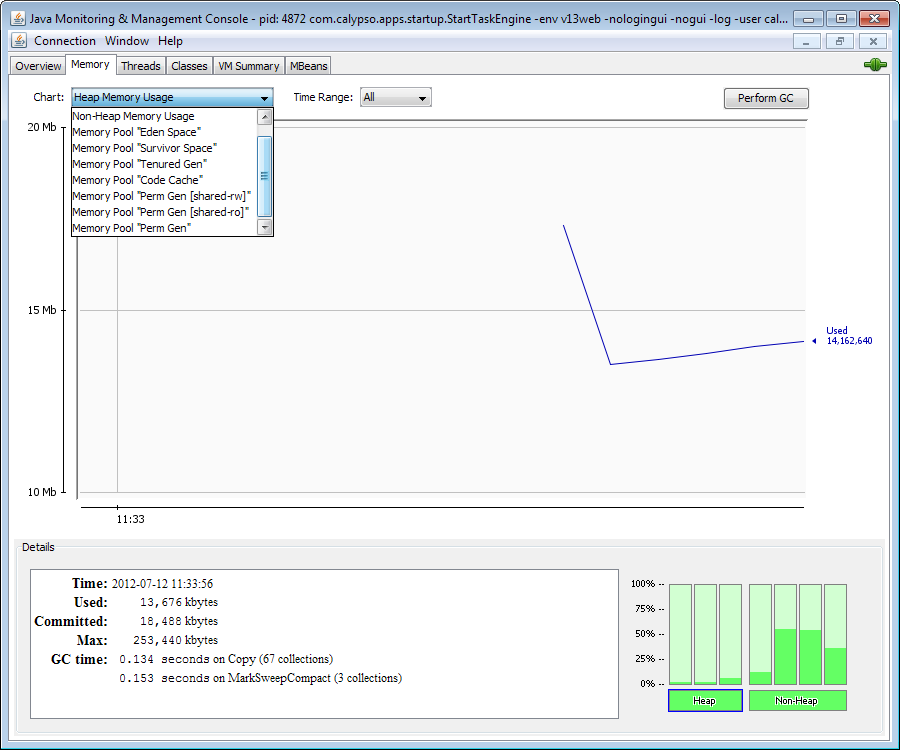
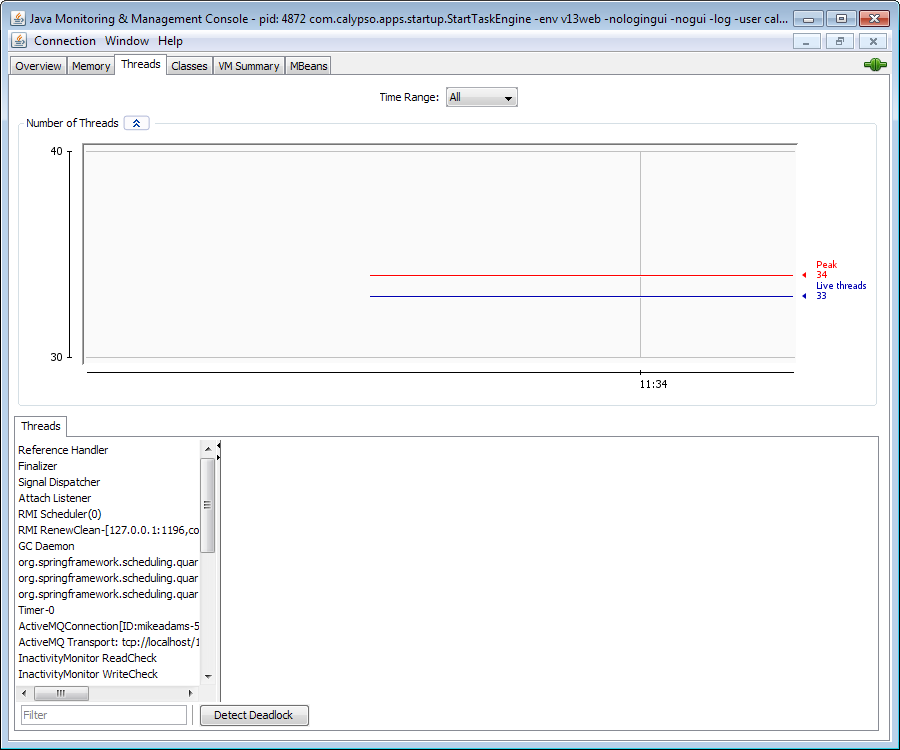
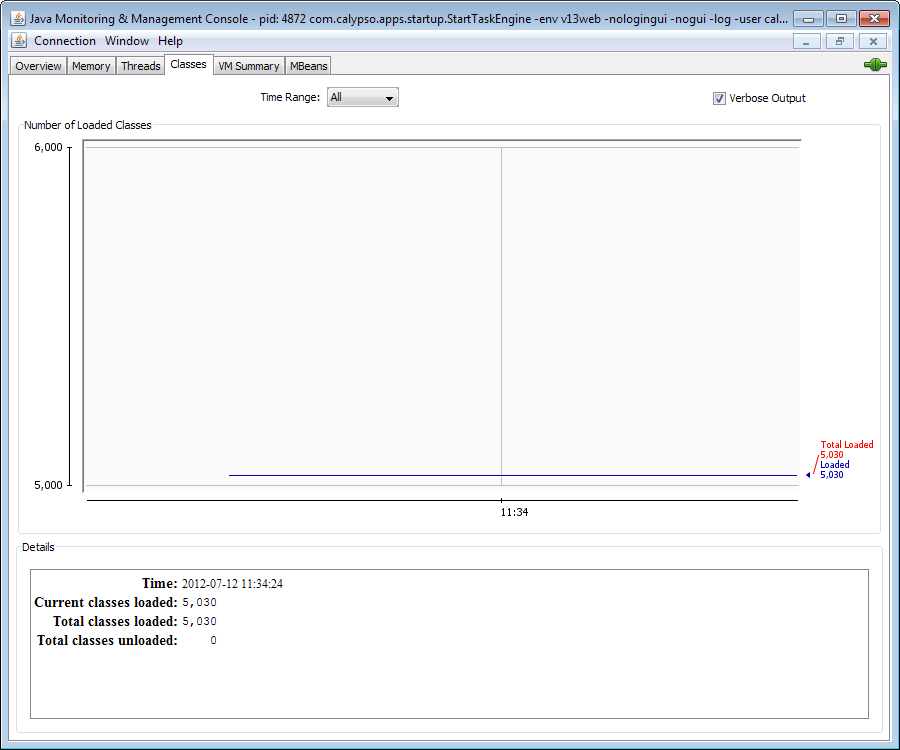
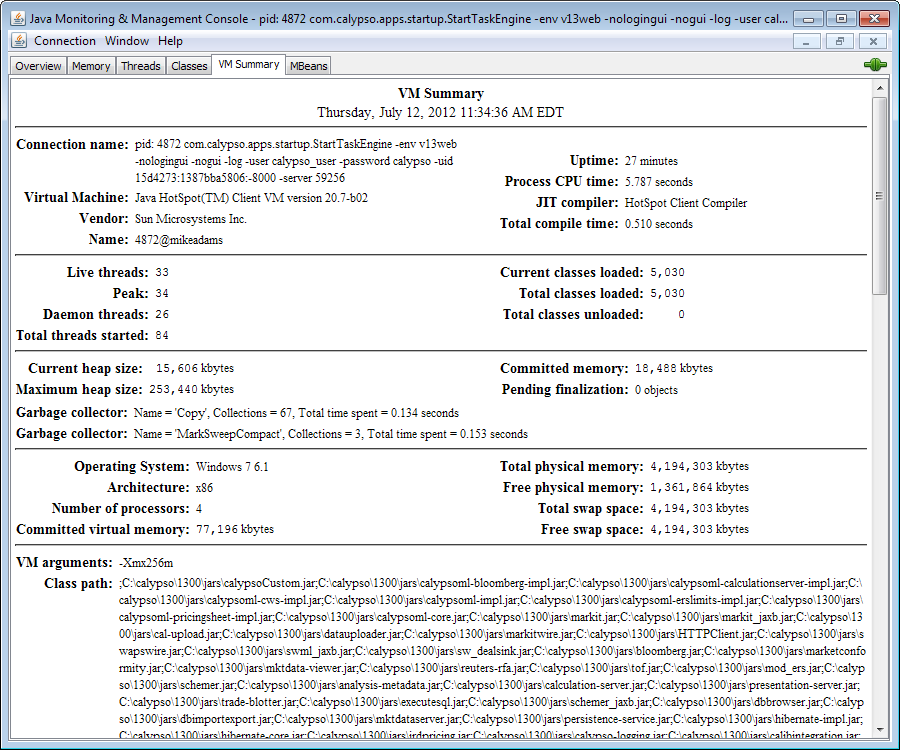
The following figures provide examples of the Monitoring window displaying information pertaining to the Calypso Task Engine.
Overview Tab
Memory Tab
Threads Tab
Classes Tab
VM Summary Tab
MBeans Tab
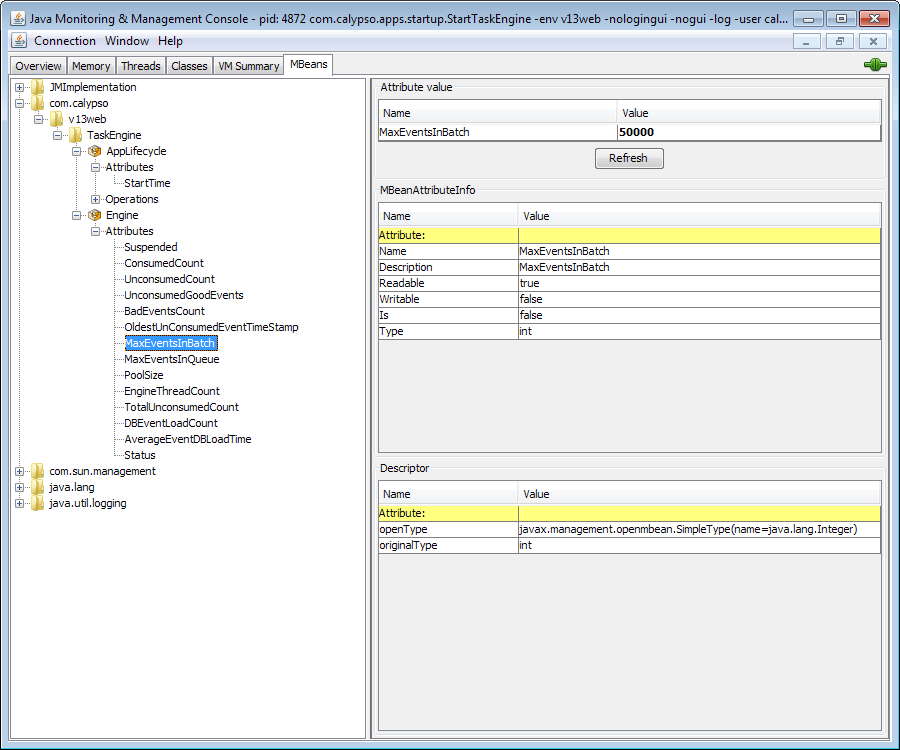
7.3 Exposed Metrics in Calypso
Exposed by All Server Components
| Metric Name | Description |
|
Application Start Time |
Time when the application was started. |
| Metric Name | Description | |||||||||
|
Persisted Event Queue |
Current persisted event queue per engine. |
|||||||||
|
Cache Metrics |
The following are exposed for each Cache within the Data Server:
|
|||||||||
|
List of Logged in Users |
List of Users logged on for the Corresponding Tenant that this DataServer belongs to (Multi-Tenancy implementations), or simply a list of Users currently logged on to the Data Server (traditional Calypso implementation). |
| Metric Name | Description | ||||||||||||
|
Engine Mode |
Current mode of the engine in the following form:
|
||||||||||||
|
Thread Count |
The number of engine threads currently running. |
||||||||||||
|
Unconsumed Events count / Event Type |
They count of the unconsumed Events by Event Type. |
||||||||||||
|
Bad Event Count |
The count of events that the engine was not able to read/process. |
||||||||||||
|
Unconsumed Good Events |
The difference between the Unconsumed Events Count and Bad Events Count. If this number is positive and not decreasing, the engine is not consuming events. |
||||||||||||
|
Average Event Load Time |
The Average time to load events from the Database. |
||||||||||||
|
Event Load Count |
The number of times that events are loaded from the Database. |
||||||||||||
|
Start Time |
Engine start time/ |
||||||||||||
|
MaxEventsInBatch |
The maximum number of Events to fetch from the Database in a single request when the engine is in batch mode. |
||||||||||||
|
MaxEventsInQueue |
The maximum number queued Events held the engine before the engine switches to batch mode. |
||||||||||||
|
Oldest Unconsumed Event Timestamp |
The creation timestamp of the oldest unconsumed Event. |
7.4 Disabling JMX Monitoring
If you wish to disable JMX Monitoring, launch Calypso using the following JVM argument:
-Dcom.calypso.management.jmxenabled=false