Risk Server Web Admin
The Risk Server Web Admin allows viewing information and logs pertaining to the Risk Server.
Default Risk Server Web Admin: http://localhost:8160
1. Server Menu
The Server menu for the Risk Server Web Admin has the following menu items:
| • | Information |
| • | Environment Properties |
| • | System Properties |
| • | Messenger |
| • | Patcher Audit Information |
 See Data Server Web Admin for details.
2. Metrics Menu
The menu items of the Metrics menu are described below.
2.1 Caches
This window allows viewing client caches, and clearing client caches.
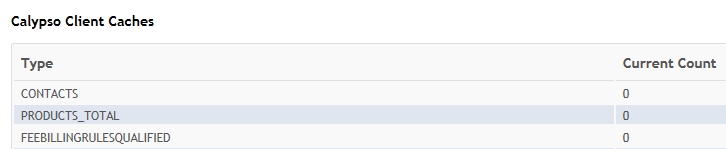
You can click Clear Caches to clear all Client Caches.
2.2 Pending Events
This window displays the number of pending events per engine and event class.
3. Profiler Menu
The "Request" menu item is described below.
It brings up the Client Request Profiler window that allows viewing and downloading profiler information on the client.
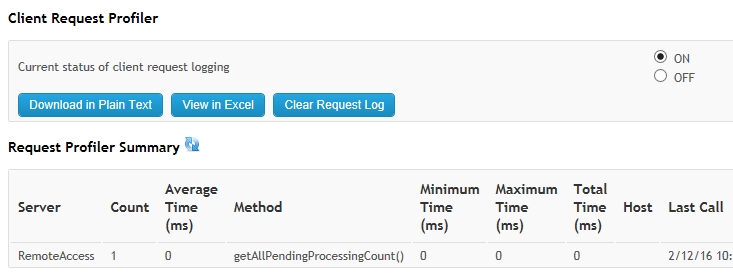
| » | Check "ON" to enable profiling, or "OFF" to disable profiling. |
| » | Click |
You can click Download in Plain Text to download a plain-text version of the Profiler log.
You can click View in Excel to download a CSV version of the Profiler log.
You can click Clear Request Log to clear the current information from the Profiler log.
4. Monitoring Menu
The menu items of the Monitoring menu are described below.
4.1 Alerts
See Alerts for details.
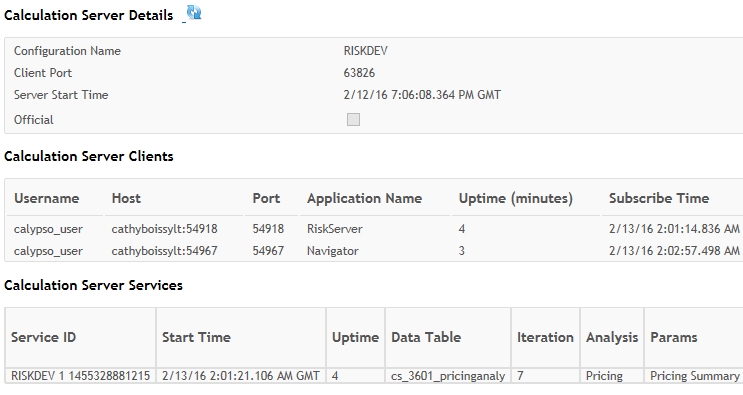
4.2 Calculation Server
This window allows monitoring the Calculation Server. Runtime changes and configuration changes are not possible from this window.
You can click ![]() to refresh the display.
to refresh the display.
Calculation Server Details
| Item Name | Description |
| Configuration Name |
The name of the configuration used to launch the server. |
| Client Port |
|
| Server Start Time |
The time the server launched. |
| Official |
Appears checked for an "official" calculation server used for computing intraday risk, or clear for a "non-official" adhoc calculation server used for computing on-demand risk reports. |
Calculation Server Clients
| Item Name | Description |
| Username |
The name of the User who initiated the report. |
| Host |
The machine that is running the server. |
| Port |
The port. |
|
Application Name |
The name of the report. |
| Uptime (minutes) |
How long the server has been running. |
|
Subscribe Time |
The time the user subscribed to the report. |
Calculation Server Services
| Columns Names | Description |
|
Service ID |
Unique identifier of the analysis run. |
|
Start Time |
The time at which this analysis was first loaded. |
|
Uptime (mins) |
The total time this analysis has been up and running in minutes. |
|
Data Table |
The name of the database table to which the results of analysis run are persisted. |
|
Iteration |
The number of runs or iteration this analysis has gone through. |
|
Analysis |
Analysis Type. |
|
Params |
Name of analysis parameters. |
|
Trade Filter |
The name of the trade filter that this analysis is run against. |
|
Pricing Env |
The pricing env that this analysis uses. |
|
Val Date |
The valuation datetime of the analysis. |
|
Trade Freq |
Frequency of trade incremental update (in seconds). |
|
MDI Freq |
Frequency of the market data incremental update (in seconds). |
|
Current Run |
Shows updates currently being processed by the Calculation Server. To see data in this section, you would need to click |
|
Initial Run |
Shows the number of trades and the duration of the computation when the report is first open. |
|
Next Run |
Shows the update that is scheduled right after the last run. For example, the Calculation Server just processed a trade update and there is a market data update waiting to be processed. When you click |
|
Last Run |
Shows the last update that has been processed. It only shows one update at a time. |
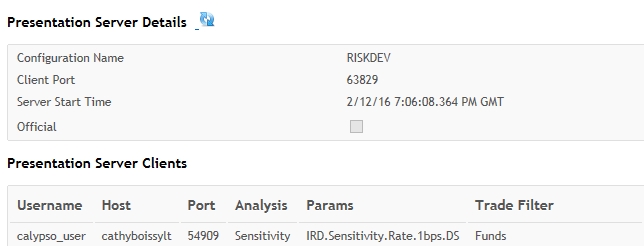
4.3 Presentation Server
This window allows monitoring the Presentation Server. Runtime changes and configuration changes are not possible from this window.
You can click ![]() to refresh the display.
to refresh the display.
Presentation Server Details
| Item Name | Description |
| Configuration Name |
The name of the configuration used to launch the server. |
| Client Port |
|
| Server Start Time |
The time the server launched. |
| Official |
Appears checked for an "official" presentation server used for computing intraday risk, or clear for a "non-official" adhoc presentation server used for computing on-demand risk reports. |
Presentation Server Clients
| Item Name | Description |
| Username |
The name of the User who initiated the report. |
| Host |
The machine that is running the server. |
| Port |
The port. |
| Analysis |
Analysis Type. |
| Params |
The parameters used to run the report. |
|
Trade Filter |
The name of the trade filter that this analysis is run against. |
|
Pricing Env |
The pricing env used by this analysis. |
|
Val Date |
The valuation datetime of the analysis. |
|
Application Name |
The name of the report. |
|
Subscribe Time |
The time the user subscribed to the report. |
|
Last Query Time (ms) |
The time the report began. |
|
Last Response Time (ms) |
The duration spent creating the output. |
5. Logs Menu
The Logs menu brings up the Server Logs window that allows configuring logging levels and viewing log files.
See Data Server Web Admin for details.