Calypso Workstation Usage
The Calypso Workstation allows viewing risk results from risk reports processed by the risk servers: Presentation Server and Calculation Server.
"Official" risk servers should be running to compute live reports; they should have a configuration that indicates which risk reports they need to compute.
"Adhoc" risk servers should be running to load saved reports; they should have a configuration that indicates which risk reports they need to load.
 See Computing Risk Reports for details on adding risk reports to risk servers.
Contents
- Calypso Workstation - Workstation Menu
- Calypso Workstation - Edit Menu
- Calypso Workstation - Panel Menu
- Calypso Workstation - Reports Menu
- Calypso Workstation - Window Plan Menu
- Calypso Workstation - Trade Menu
1. General Usage
Click Workstation in the Calypso Navigator to open the Calypso Workstation.
When you open the Calypso Workstation, it displays by default the reports that were previously open upon closing.
The first time, however, it will be empty.
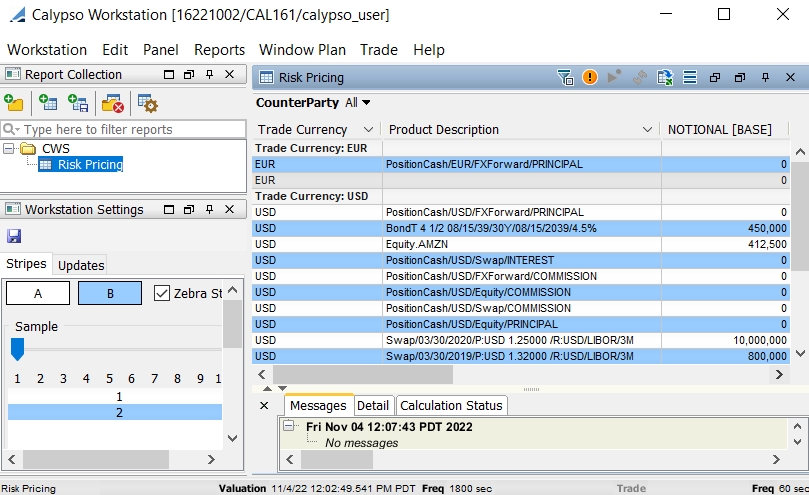
Sample Calypso Workstation
The Calypso Workstation shows the following windows:
You can choose which window to display or hide from the Panel menu, and save the layout of the window from the Window Plan menu.
| • | "Report Collection" - To add / remove / load reports to the Calypso Workstation – Each report has a user-defined name. |
| • | A panel for each report that displays the report's results – The panel’s name is the report’s user-defined name. |
| • | "Drilldown" - To drill-down to a detailed report for a given cell - It requires the setup of a drill-down report plan using |
| • | "Market Data" - To show market data for live reports. |
| • | "Credit Market Data" - To show credit market data for live reports. |
| • | "Quotes" - To show real-time quotes for live reports. |
| • | "On Demand Analysis" - To access risk speed buttons to run risk reports on-the-fly. |
| • | "Quick Trade" - To access trade speed buttons to capture trades. |
| • | "Global Filters" - To define global filters on the reports. |
| • | "CWS Settings" - To set general preferences. |
All of these windows are described below in details.
You can hide a window by clicking ![]() . It will appear as
a tab on the left-hand side:
. It will appear as
a tab on the left-hand side:
Hidden window
To bring it back, select the tab and click ![]() .
.
Open window
To close a window, click ![]() .
.
You can also use the Panel menu to open and close windows.
2. Adding a Report
You can add the reports you want to display to the “Report Collection” window.
Note that only risk reports configured to run in risk servers can be added to the Calypso Workstation.
See Computing Risk Reports for details.
You can use the search bar to search existing reports. If you click the down arrow next to the search icon ![]() to specify search criteria as needed.
to specify search criteria as needed.
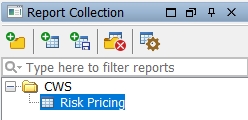
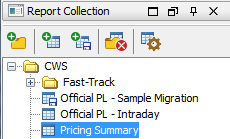
Report Collection window
2.1 Adding Folders
You can organize reports into folders. Select the root level or any existing folder, and click ![]() to add a new folder. You will be
prompted to enter a folder name.
to add a new folder. You will be
prompted to enter a folder name.
2.2 Adding Live Reports
Select the root level or any existing folder, and click ![]() . You will be
prompted to enter a name – This name is for the purposes of the Calypso Workstation only.
. You will be
prompted to enter a name – This name is for the purposes of the Calypso Workstation only.
| » | You will be prompted to select which report you want to display. |
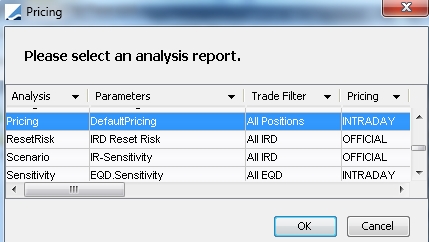
All the reports displayed here are configured in a Calculation Server.
Select a report and click OK.
Once a report has been added to the Report Collection window, you can select it and click ![]() if you want to change anything.
if you want to change anything.
| » | The first time a report is added, you will be prompted to select a report plan if a report plan exists for this type of report. Otherwise, you will be prompted to configure a report plan (columns, filtering, sort order, etc.). |
See Configuring Report Plans for details.
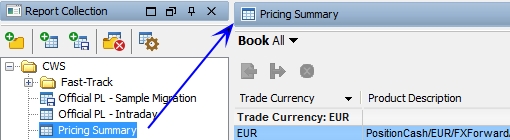
The report results are then displayed in a panel on the right-hand side of the Calypso Workstation.
2.3 Adding Saved Reports
Select the root level or any existing folder, and click ![]() . You will be
prompted to enter a name – This name is for the purposes of the Calypso Workstation only.
. You will be
prompted to enter a name – This name is for the purposes of the Calypso Workstation only.
| » | You will be prompted to select which saved report you want to display. |
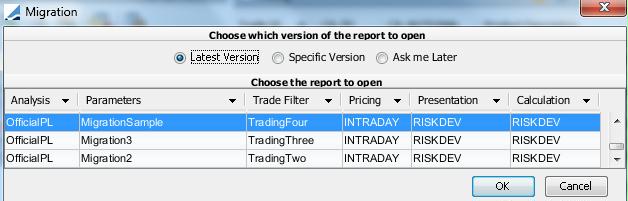
All the reports displayed here are configured in a Calculation Server.
Select a report and choose the version of the report to be displayed:
| – | Latest Version - Always displays the latest results saved for the report. |
| – | Specific Version - Displays specific saved results. You will be prompted to select the date and time of the saved results. |
| – | Ask me Later - No results are displayed - When you open the report, you will be prompted to select the date and time of the saved results. |
Then click OK.
Once a report has been added to the Report Collection window, you can select it and click ![]() if you want to change anything.
if you want to change anything.
| » | The first time a report is added, you will be prompted to select a report plan if a report plan exists for this type of report. Otherwise, you will be prompted to configure a report plan (columns, filtering, sort order, etc.). |
See Configuring Report Plans for details.
The report results are then displayed in a panel on the right-hand side of the Calypso Workstation.
3. Viewing Results
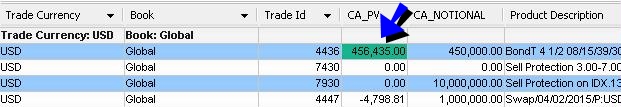
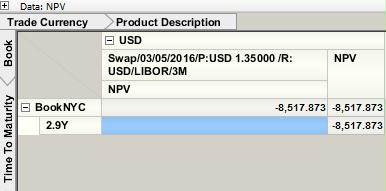
If the results of a report are not displayed, double-click the report in the Report Collection window to load the corresponding results in a result panel.
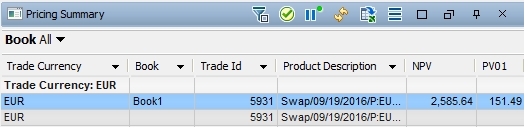
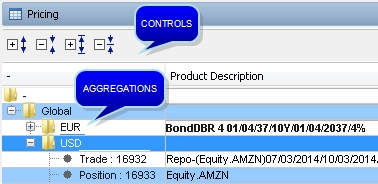
Sample report result panel
Once the results are displayed, a number of menus and functions become available. They are described below.
If no report plan is associated with the report, you will be prompted to select a report plan if a report plan exists for this type of report. Otherwise, you will be prompted to configure a report plan.
You can always adjust the display later using ![]() > Configure Report Plan.
> Configure Report Plan.
In Simple view, you can click a column heading to set local filters.
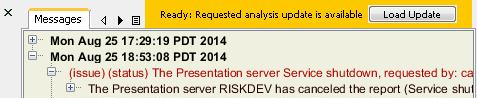
The Messages window will appear in case of error while loading the report results.
Ⓘ [NOTE: You can only view results that are computed by the risk reports as defined in the parameters of the risk reports]
If the risk server fails before the Calypso Workstation opens a report, the report fails to open, and an error is displayed in the report results.
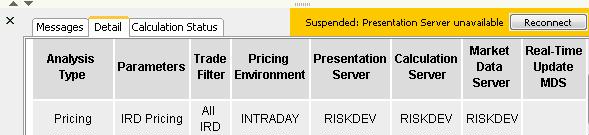
If the risk server goes offline after the Calypso Workstation has displayed the results, an error message is displayed, and the Reconnect button allows the user to reconnect to the risk server.
Most user actions are disabled when the risk servers are offline and the remaining actions are sometimes ignored if they depend upon unavailable functionality.
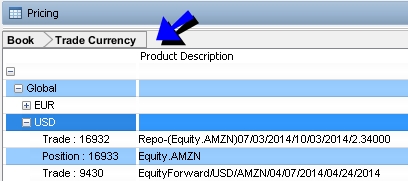
3.1 Viewing the Slice Control Bar
If the report has been configured with slices, click ![]() to display / hide the slice control bar.
to display / hide the slice control bar.
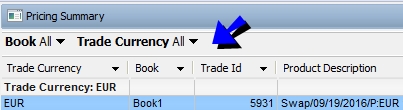
When you click the down arrow of a given slice , you can select which values to display:
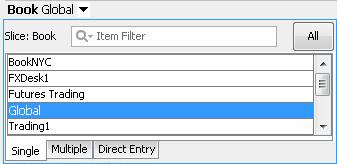
| • | Single - To select a single value. |
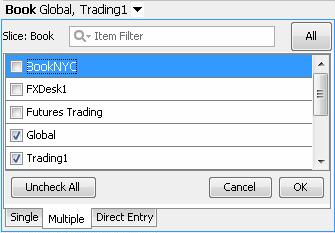
| • | Multiple - To select multiple values. |
| • | Direct Entry - To type in the values. You can also paste values copied from an Excel spreadsheet. |
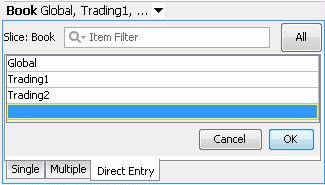
At any time, you can click All to select all values.
3.2 Viewing Report Details

In the toolbar of the report result panel, click ![]() to view details about the
report.
to view details about the
report.
This icon will appear as ![]() instead for warning messages, or
instead for warning messages, or ![]() for error messages.
for error messages.
Messages Panel
Select the Messages panel to view any error message if any.
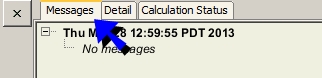
Error messages
Detail Panel
Select the Detail panel to view configuration details about the report.
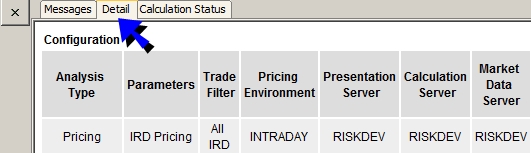
Report configuration details
Calculation Status Panel
Select the Calculation Status panel to view statistics about the Calculation Server, and real-time data information: trade updates, market data updates, market data catch-up updates.
This panel only applies to live reports.
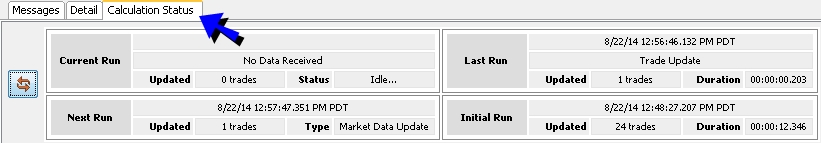
Calculation Server statistics
Click ![]() to view current data about the Calculation Server.
to view current data about the Calculation Server.
| • | Current Run - Shows updates currently being processed by the Calculation Server. To see data in this section, you would need to click |
| • | Last Run - Shows the last update that has been processed. It only shows one update at a time. |
| • | Next Run - Shows the update that is scheduled right after the last run. |
For example, the Calculation Server just processed a trade update and there is a market data update waiting to be processed. When you click ![]() , the trade update will appear in Last Run, and the market data update will appear in Next Run.
, the trade update will appear in Last Run, and the market data update will appear in Next Run.
| • | Initial Run - Shows the number of trades and the duration of the computation when the report is first open. |
3.3 Enabling / Disabling Live Updates

For a live report, you can resume / freeze trade and market data updates using the icons ![]() (resume updates) and
(resume updates) and ![]() (freeze updates).
(freeze updates).
By default, the trade and market data updates are enabled, so you see the ![]() icon.
icon.
The trade and market data updates trigger the computation of the report at the frequency specified in the Calculation Server configuration. You can select the Calculation Status panel in the report details to view if any update has occurred.
See Viewing Report Details for details.
You can also specify colors in the CWS Settings to highlight updates in the results.
See Setting Preferences for details.
3.4 Refreshing Market Data

For a live report, you can refresh market data using the ![]() icon to force the computation of the report at any time during the real-time update period. The process is as follows:
icon to force the computation of the report at any time during the real-time update period. The process is as follows:
Say your real-time updates are configured to be processed every 20 minutes, or real-time updates are frozen. There is a market data update 5 minutes after the last run, and you want to see how it impacts your results.
In this case, you need to click ![]() to freeze the real-time updates (if they are not already frozen), then click
to freeze the real-time updates (if they are not already frozen), then click ![]() to request the computation of the report with the updates. And finally, click
to request the computation of the report with the updates. And finally, click ![]() to view the actual results as soon as the computation is complete.
to view the actual results as soon as the computation is complete.
Ⓘ [NOTE: The "refresh" function requires the access permission OnDemandMktDataRefresh]
3.5 Exporting Reports

In the toolbar of the report result panel, click ![]() to export the report to one
of the formats described below.
to export the report to one
of the formats described below.
When exporting a report, the report plan is only used for the following information:
| • | Ordered column list and column names |
| • | Layout: simple, aggregation, hierarchy, pivot, or summary. |
| • | Filters |
| • | Sort order |
| • | Data grouping (slices, headings) |
The report plan is NOT used for column settings (color, format, number of decimals), and coloring rules.
Ⓘ [NOTE: The character encoding defaults to UTF-8 – You need to set the environment property DOCUMENT_CHAR_ENCODING to a different value to use a different character encoding. It is however recommended to use UTF-8]
You can also export multiple reports at a time using Reports > Export Reports.
See Calypso Workstation - Reports Menu for details.
|
Menu Items |
Description |
||||||
|
Excel |
Only available if domain "ENABLE_DEPRECATED_EXCEL_EXPORT" contains Value = true. To export the results to an Excel spreadsheet (.xls format). Ⓘ [NOTE: You need to set the environment property USE_JIDE_PIVOT_GRID to true to export a pivot view as a pivot view – Otherwise it will be exported as a simple view] When exporting a report to Excel, the report plan is also used for the following:
If a cell does not format, it commonly means that the cell contains a text or price value instead of a numeric value. Pivot row and column header values do not support formatting in general due to data structure limitations. Excel will not show full precision or () negative formats in some cases even though the file has the correct data. The user is advised to set the cell formats within Excel to match the file precision immediately after opening an Excel exported file. |
||||||
|
ExcelX (2007) |
To export the results to an Excel spreadsheet (.xlsx format). |
||||||
|
CSV |
To export the results to a text file. |
||||||
|
HTML |
To export the results to an HTML page. |
||||||
|
|
To export the results to a PDF file. You can use the environment property PDF_DOCUMENT_FONT to set the font name to be used for PDF generation. Default is Helvetica. Please refer to Calypso Environment Properties documentation for details. |
3.6 Configuring Report Plans

A report plan determines which columns to display and how.
Select a report result panel and choose ![]() > Configure Report Plan to configure the results.
> Configure Report Plan to configure the results.
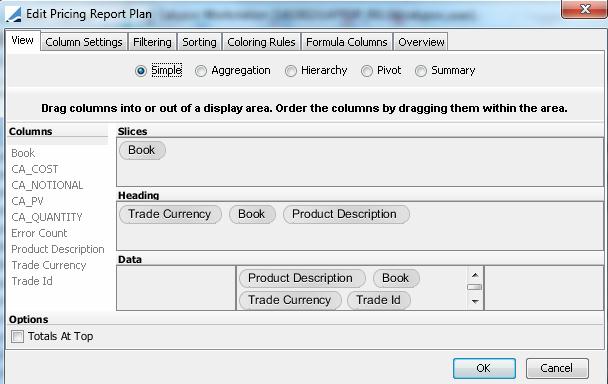
Sample Report Plan
| » | Configure the various panels described below as needed then click OK when you are done. The report results will load / reload to reflect the settings. |
| » | If you are modifying an existing report plan, you can choose |
View Panel
The View panel is selected by default.
Select the type of view: Simple, Aggregation, Hierarchy (Official P&L and Forward Ladder only), Pivot, or Summary.
For the Official P&L report, you can only select Simple or Hierarchy.
| Type of View | Description | ||||||||||||||||||
|---|---|---|---|---|---|---|---|---|---|---|---|---|---|---|---|---|---|---|---|
|
Simple |
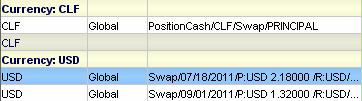
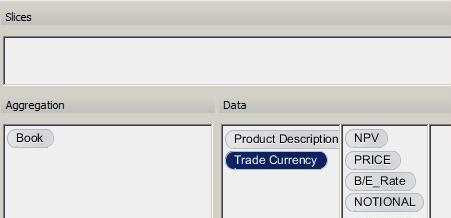
The Simple view allows displaying rows and columns in tabular format. Drag columns from the Columns area and drop them into the Slices area, Heading area, and Data area as needed. The order of the columns can be changed by simply moving them in their display area. To remove a column from a display area, drag it and drop it back into the Columns area. Columns that are not yet selected appear highlighted. Slices A Slice is a page filter in the report. Data such as Book, Product Description, and Trade Status can be set up as slices. Once slices are set up in any active view, they display as follows at the top of the report.
You can display all the values of a slice, or select one or multiple values. The slices options in the drop-down menu are obtained from the Presentation Server. Thus, the slices list is always up-to-date. Because of this, there might be a small delay in displaying the contents of the slices.
Headings Headings allow grouping rows in the report.
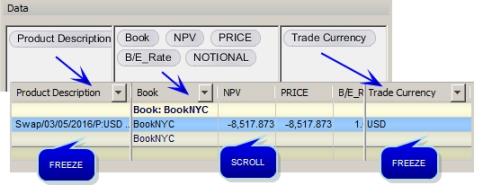
Data Data are the actual columns displayed in the report results. The Data area contains three sections in Simple view, Aggregation view, and Hierarchy view:
When fixed columns overlap each other in Aggregation view or Hierarchy view, flickering will occur. Fixed columns are designed for use with a few columns only. However, you can resize the columns to prevent flickering. You can also use the option to automatically resize the columns to prevent flickering, Options At the bottom-left of the window, you can check "Totals At Top" to display the total row at the top of the report instead of the bottom. Note that this only applies to totals, not to subtotals. |
||||||||||||||||||
|
Aggregation |
The Aggregation view allows aggregating rows based on user-defined criteria. Drag columns from the Columns area and drop them into the Slices area, Aggregation area, and Data area as needed.
These areas are described above for the Simple view. Aggregations Aggregations are similar to headings in the sense that they allow grouping rows. The difference is in the display. Each aggregation level is collapsed by default, and you have to expand it to view its details. You can select a level and hit "*" to expand all the sub-levels. You can also choose
|
||||||||||||||||||
|
Hierarchy |
Only available for the Official P&L report and Forward Ladder report. The Hierarchy view is like the Aggregation view with the addition of a navigation bar in the display.
You can expand / collapse the various levels using the navigation bar. |
||||||||||||||||||
|
Pivot |
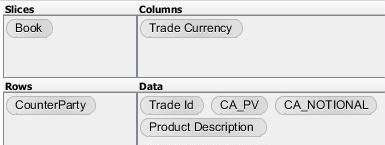
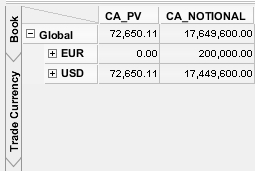
The Pivot view allows aggregating rows and columns based on user-defined criteria. Drag columns from the Columns area and drop them into the Slices area, Columns area, Rows area, and Data area as needed.
The Data are displayed in rows and are aggregated by Columns and Rows.
Options Additional settings are available on Pivot views - You can check any of the following as needed:
Drilldown View Select the drill-down report plan to be used for the Drilldown panel. Drill-down report plans are created using Ⓘ [NOTE: If you set the environment property USE_JIDE_PIVOT_GRID to true, you can export a Pivot view to Excel as a pivot view using (Ctrl+O)] |
||||||||||||||||||
|
Summary |
The Summary view is a Pivot view with navigation and drill-down capability. Each slice, row, and column can be expanded or collapsed. Note that the Summary view is not supported for reports using the "Analysis" total or subtotal function.
Options Additional settings are available on Summary views - You can check any of the following as needed:
Focus row example - If you configure a view with three row criteria: Book, Trade Currency, Trade CounterParty, and you set the focus row on Trade Currency, the report will open to the Trade Currency level by default.
Drilldown View Select the drill-down report plan to be used for the Drilldown panel. Drill-down report plans are created using |
Column Settings Panel
Select the Column Settings panel to customize column names, formats, and colors.
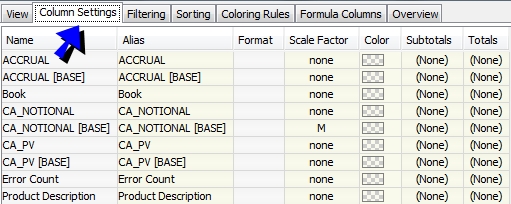
Sample column settings
| » | For a column, adjust any of the parameters as needed. You can click the parameter to view the various options, or pick the options from the graphical aids on the right-hand side of the window. |
| – | Alias - You can customize the display name of the column. |
| – | Format - You can choose the format of negative numbers, and the format of dates. |
| – | Scale Factor - You can specify a scale factor: T(rillion), B(illion), M(illion), or K(thousand). The corresponding column will be displayed accordingly. Example for 1,000,000: |
1,000,000 - no scaling factor
0.01 T
0.1 B
1 M
1,000 K
| – | Color - You can choose the background color of the column. |
| – | Subtotals - You can configure subtotals by heading level - The following functions are available depending on the type of column: Average, Count, Group, Minimum, Maximum, Sum. |
| – | Totals - You can configure a grand total - The following functions are available depending on the type of column: Average, Count, Group, Minimum, Maximum, Sum. |
| » | By default, you only see the columns selected in the View panel. You can clear "Filter Column List" at the bottom of the window to view all the columns available in the report. |
Filtering Panel
Select the Filtering panel to set filters for this report.
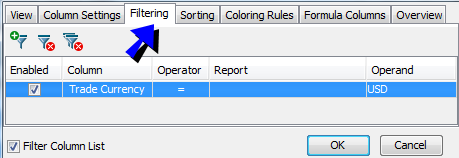
Sample filtering
| » | Click
|
By default, you only see the columns selected in the View panel. You can clear "Filter Column List" at the bottom of the window to view all the columns available in the report.
Repeat as needed to add more filters.
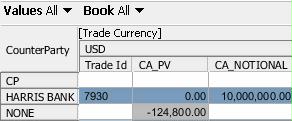
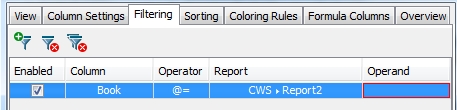
| » | You can select another report for reference to filter a column based on the other report's column. See example below. |
For example, Report2 is defined as showing only Book = Global.
Report1 is now configured as showing Book as in Report2. Hence, it will also show only Book = Global.
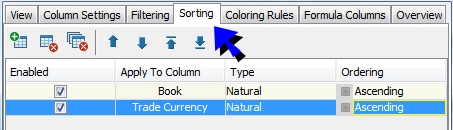
Sorting Panel
Select the Sorting panel to set up sorting details.
Sample sorting
| » | Click |
By default, you only see the columns selected in the View panel. You can clear "Filter Column List" at the bottom of the window to view all the columns available in the report.
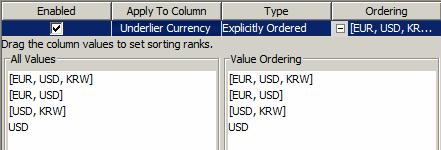
| » | For a string column, you can select the type "Explicitly Ordered" and define a custom order. |
Coloring Rules Panel
Select the "Coloring Rules Panel" to set color coding on rows or on individual cells. You will be prompted to define rules and select colors.
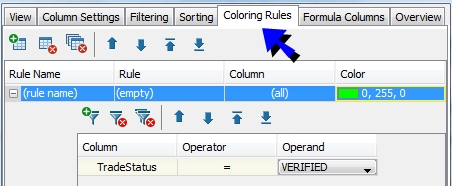
Sample coloring rules
| » | Click
|
| » | Double-click the Rule field to define the rule. |
Click ![]() to add a condition in the rule. Select a column, an operator, and a value.
to add a condition in the rule. Select a column, an operator, and a value.
By default, you only see the columns selected in the View panel. You can clear "Filter Column List" at the bottom of the window to view all the columns available in the report.
| » | Once the rule is defined, you can select the column to which the rule applies (or All), and select the color you want to apply. |
If multiple rules are set, the order of precedence is determined by the sequential order in which they appear from top to bottom. The rules can be moved up and down via the arrows in the dialog.
[NOTE: The order of precedence only applies to rules of the same type (“Row - All Columns” or a specific “Cell - Column”)]
If you have setup multiple types of rules, Cell Color takes precedence over Row Color, Column Color, and Zebra Color, in that order.
Formula Columns Panel
Select the "Formula Columns" panel to define custom columns.
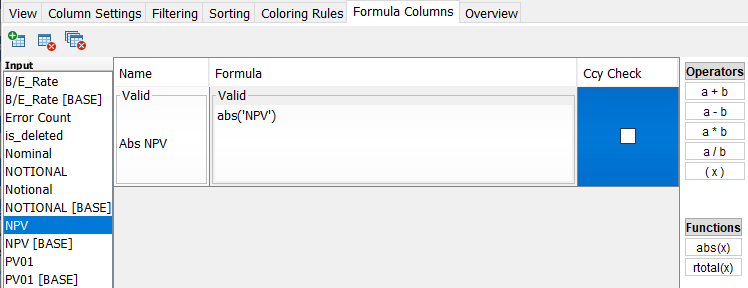
Sample formula column
The available operators are shown on the right-hand side. The format of a custom column is 'column'operator'column', 'column' can also be a constant.
| » | To create a formula column, click |
| » | Enter a name for the formula column in the Name field. |
| » | Enter the formula in the Formula field. For this, position your cursor in the formula field, then you can drag and drop columns from the Input field into the Formula field, or double-click a column from the Input field. You can also type in the column names in between single quotes. Then type in the operator, and add another column or constant as needed. |
You can also use the functions: abs(x) and rtotal(x). abs(x) provides absolute value and rtotal(x) provides the running total for a particular column, such as Cash or Quantity. rtotal(x) is only available in Pivot view.
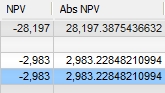
Valid examples are shown below:
'Time Effect'+'Market Data Effect'
abs('NPV')
rtotal('NPV')
2*'Time Effect'
| » | Check “Ccy Check” as needed (default value can be set in domain “CWS_CcyCheck” - true or false) - This only applies to simple sums and subtractions - When checked (true) for a given formula, the formula returns 0 if it contains amounts in different currencies - Amounts in different currencies cannot be added if they are not converted to the same currency. This can only be used for convertible pricer measures (you can refer to the Pricer Measures documentation for information on which pricer measures are convertible.) |
| » | Then click OK. |
The formula column can now be displayed in the results. It is not available for sorting or filtering.
Ⓘ [NOTE: Formula columns are not supported in the Forward Ladder]
![]() If you have the following error: “Unable to allocate worktable for processing group by or distinct clause during query optimization. Maximum limit (46) of worktables is exceeded”, please consider reducing the number of columns in the configured report and retry.
If you have the following error: “Unable to allocate worktable for processing group by or distinct clause during query optimization. Maximum limit (46) of worktables is exceeded”, please consider reducing the number of columns in the configured report and retry.
Overview Panel
Select the Overview panel to display a summary of the report's settings.
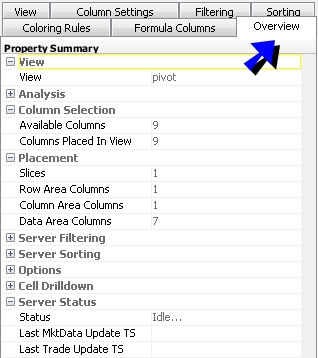
Sample overview
It also shows the last time trades and market data were updated.
3.7 Managing Saved Report Plans
You can choose Reports > Manage Saved Report Plans to manage existing report plans.
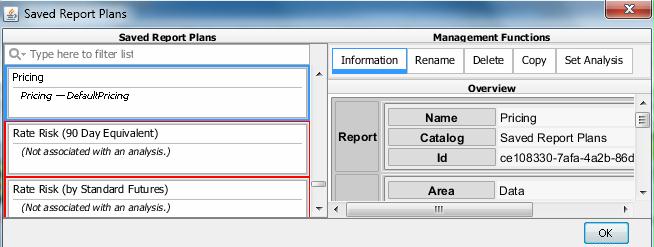
Sample report plan manager
Report plans appear in red if they are not associated with any report.
| » | To associate a report plan with a report, select a report plan and select the "Set Analysis" panel. |
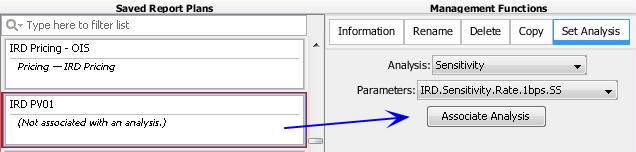
Select a report type and a set of parameters, and click Associate Analysis.
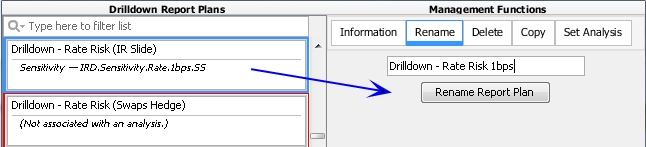
| » | You can select a report plan and rename it. Select a report plan and select the "Rename" panel. |
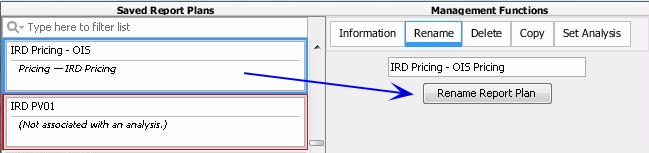
Change the name and click Rename Report Plan.
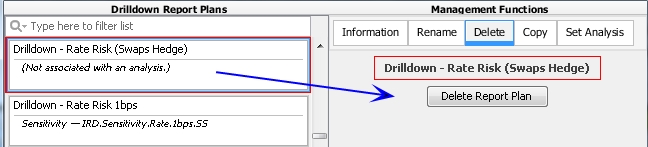
| » | You can select a report plan and delete it. Select a report plan and select the "Delete" panel. |
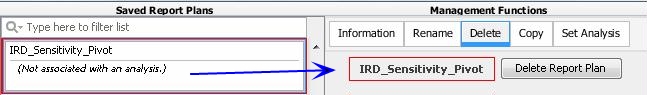
Click Delete Report Plan to delete it.
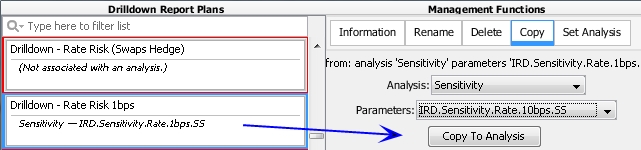
| » | You can select a report plan and copy it to another report. Select a report plan and select the "Copy" panel. |
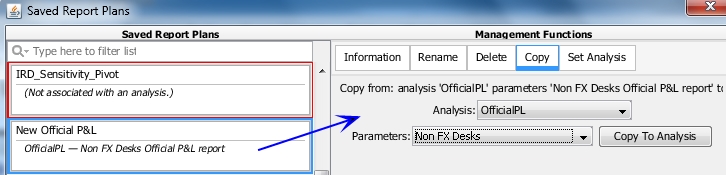
Select a report type and a set of parameters, and click Copy To Analysis.
| » | Click OK to apply your changes. |
3.8 Adding Trade Action Buttons
Select a report result panel and choose ![]() > Edit Trade Action Bar to define trade action buttons.
> Edit Trade Action Bar to define trade action buttons.
Ⓘ [NOTE: Actions buttons can only be defined for Simple views]
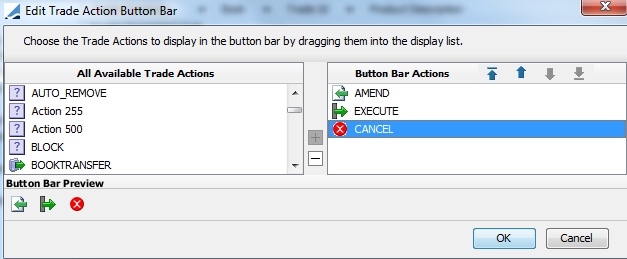
Sample action configuration
| » | Select an action from the left-hand side and click + to add it to the trade action toolbar. |
| » | Click OK to apply your changes. |
Action buttons are displayed in the report’s toolbar when you choose ![]() > Show Trade Action Bar.
> Show Trade Action Bar.
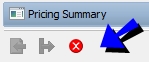
Sample trade action bar
| » | Select a trade from a report and click an action button to apply the corresponding action. |
3.9 Report Menu
Click ![]() to bring up the report menu in a result panel.
to bring up the report menu in a result panel.
|
Menu Items |
Description |
|||
|
Configure Report Plan |
To configure a report plan.
|
|||
|
Save Report Plan |
To save the current report plan to the database. You will be prompted to enter a report plan name. All report plans are saved in the private catalog of the user. You can use Workstation > Distribute to distribute report plans to other users. |
|||
|
Edit Analysis |
To display the report parameters. If you modify the parameters, a message indicates that the report has been stopped and is being recomputed. When it is done, a new message indicates that you need to reload the report. Ⓘ [NOTE: You can only modify the parameters for live reports]
|
|||
|
Clear Local Column Filter |
Only applies to reports in Simple view if filters have been set on the column headings. To clear any filter set locally on the columns headings. |
|||
|
Automatic Column Width |
Only applies to reports in Aggregation view and Hierarchy view. This menu item operates as a checkbox. Check to automatically resize columns when fixed columns overlap and may cause flickering. |
|||
|
Show Trade Action Bar |
Only applies to reports in Simple view. This menu item operates as a checkbox. Check to display action buttons, or clear otherwise.
|
|||
|
Show View Controls |
Only applies to reports in Aggregation view. This menu item operates as a checkbox. Check to display a set of controls that allow expanding / collapsing the aggregations at various levels. |
|||
|
Edit Trade Action Bar |
Only applies to reports in Simple view. To define trade action buttons.
|
|||
|
Save Report Plan As |
To save the current report plan to a new report plan. |
|||
|
Apply Saved Report Plan |
To apply an existing report plan to the current report. You will be prompted to select a report plan. |
|||
|
Set Drilldown Report Plan |
Only applies to reports in Pivot view and Summary view. To select a drill-down report plan for the Drilldown panel. You will be prompted to select a drill-down report plan. Drill-down report plans are created using "Create New Drilldown Report Plan" see below. |
|||
|
Create New Drilldown Report Plan |
Only applies to reports in Pivot view and Summary view. To create a drill-down report plan for the Drilldown panel.
|
4. Viewing Drill-down Details
When you have a report in Pivot view or Summary view, you can click a cell and display details of the trades / positions contained in that cell in the Drilldown panel.
To do so, you need to create a drill-down report plan using ![]() > Create New Drilldown Report Plan, and associate the drill-down report plan with the Pivot / Summary view under
> Create New Drilldown Report Plan, and associate the drill-down report plan with the Pivot / Summary view under ![]() > Configure Report Plan or
> Configure Report Plan or ![]() > Set Drilldown Report Plan.
> Set Drilldown Report Plan.
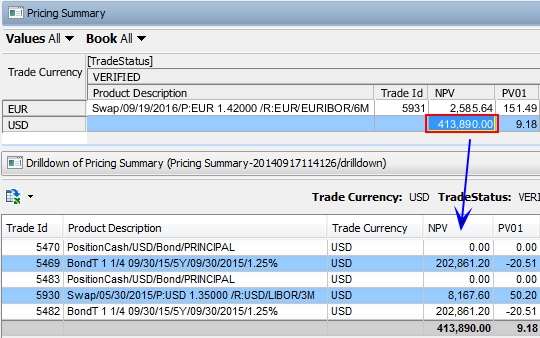
Sample drill-down results
| » | You can click |
See Exporting Reports for details.
| » | You can choose |
4.1 Creating a Drill-down Report Plan
To create a drill-down report plan, select the result panel of a report in Pivot view or Summary view, and choose ![]() > Create New Drilldown Report Plan.
> Create New Drilldown Report Plan.
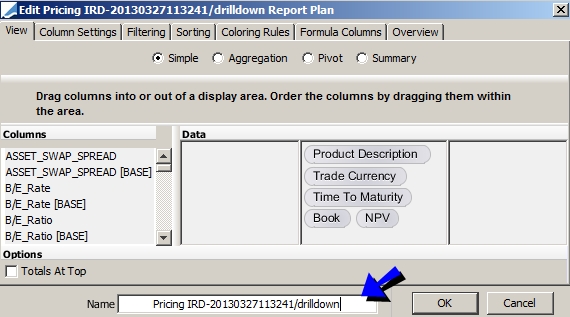
Sample drill-down report plan
It is similar to creating a report plan, except that you have to give it a name.
See Configuring Report Plans for details.
4.2 Managing Drill-down Report Plans
You can choose Reports > Manage Drilldown Report Plans to manage existing drill-down report plans.
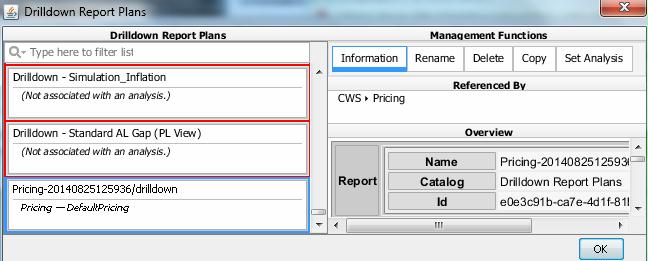
Sample drill-down report plan manager
Drilldown report plans appear in red if they are not associated with any drilldown report.
| » | To associate a report plan with a drilldrown report, select a report plan and select the "Set Analysis" panel. |
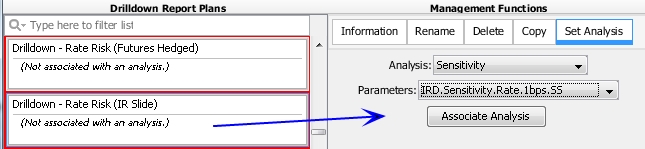
Select a report type and a set of parameters, and click Associate Analysis.
| » | You can select a report plan and rename it. Select a report plan and select the "Rename" panel. |
Change the name and click Rename Report Plan.
| » | You can select a report plan and delete it. Select a report plan and select the "Delete" panel. |
Click Delete Report Plan to delete it.
| » | You can select a report plan and copy it to another drilldown report. Select a report plan and select the "Copy" panel. |
Select a report type and a set of parameters, and click Copy To Analysis.
| » | Click OK to apply your changes. |
5. Running Reports on-the-fly
You can run reports on-the-fly on selected trades, using one of the following methods:
| • | Choose Reports > On Demand Analysis, and select the Ad Hoc panel - Select the input parameters and the report parameters, and click Run. |
| • | Choose Reports > On Demand Analysis, and select the On Demand panel - Select the input parameters and click a predefined report, and click Run. |
| • | Click a risk speed button in the "On Demand Analysis" panel - Risk speed buttons can be defined using Reports > On Demand Analysis Speed Buttons. |
The results will be displayed in a new window, or saved to a file, based on the selected parameters.
See On Demand Analysis for complete details on using the On Demand Analysis window and defining risk speed buttons.
6. Setting Trade Speed Buttons
Select the Quick Trade window to configure and use trade speed buttons.
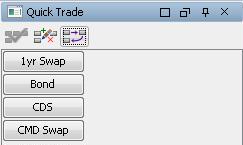
Sample quick trade buttons
6.1 Configuring Trade Speed Buttons
Click ![]() to configure a trade speed button.
to configure a trade speed button.
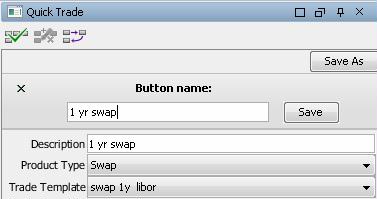
Sample quick trade configuration
| » | Enter a button name, a description, select a product type and a trade template. |
Trade templates are created from the trade worksheets.
You can also select the product type "PricingSheet" to open a blank Pricing Sheet (You cannot select a template in that case but you will be able to select a template in the Pricing Sheet once you click the corresponding trade speed button).
| » | Click Save. The speed button is added to the Quick Trade window. |
Click ![]() to view the trade speed buttons.
to view the trade speed buttons.
6.2 Using Trade Speed Buttons
Click a trade speed button to bring up the corresponding trade worksheet, or a blank pricing sheet. Help is available from all trade worksheets for details on capturing and pricing trades, and from the Pricing Sheet.
You can click ![]() to arrange the trade speed buttons in multiple rows and columns as you wish.
to arrange the trade speed buttons in multiple rows and columns as you wish.
7. Setting Global Filters
Global filters apply to all reports currently loaded in the Calypso Workstation. You can also set filters for a given report when configuring its report plan.
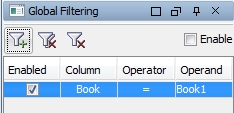
Sample global filter
| » | Click
|
Select a column, an operator, and a value for the filter.
Repeat as needed to add more filters.
| » | Check the "Enabled" checkbox to activate the filter. |
You can then clear the "Enabled" checkbox to deactivate the filter as needed.
8. Viewing Quotes
Shows real-time quotes for live reports.
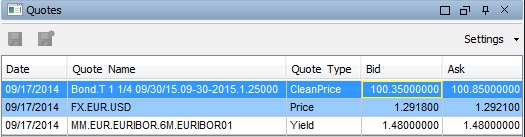
Sample quotes
It only shows quotes for rows selected in the current report.
| » | You can customize the display using Settings > Configure View. |
See Configuring Reports Plans for details.
| » | You can modify a quote – It will be set as a “What-if” quote. You can save selected or all “What-if” quotes. |
You can enter a spread in the Bid Ask Spread. It will be used when entering a “what-if” bid or ask quote to compute the corresponding bid or ask quote.
Ⓘ [NOTE: If you have setup entitlement with the quotes provider, it will be respected in that window - You can only view / modify quotes that you are entitled to view / modify - Note however that entitlement does not apply when computing the results - They are computed using any quote that is required and no entitlement check is performed per user]
9. Viewing Market Data
Shows market data for live reports.
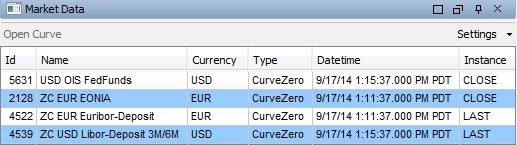
Sample market data
It only shows market data for rows selected in the current report.
| » | You can customize the display using Settings > Configure View. |
See Configuring Reports Plans for details.
| » | You can double-click a market data item to bring it up, or select a market data item and click Open Curve. |
10. Viewing Credit Market Data
Shows credit market data for live reports based on the selected scope.
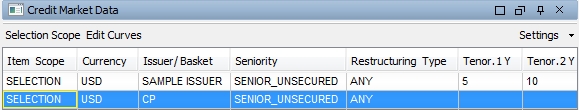
Sample credit market data
| » | You can select a scope: Click Selection Scope to switch to Analysis Scope and vice versa. |
| – | "Selection Scope" - Only shows credit market data items for rows selected in the current report - Default scope. |
| – | "Analysis Scope" - Shows all credit market data items for the current report. |
| » | You can customize the display using Settings > Configure View. |
See Configuring Reports Plans for details.
| » | You can double-click a market data item to bring it up, or select a market data item and click Edit Curves. |
11. Setting Preferences
Select the CWS Settings panel to set general preferences.
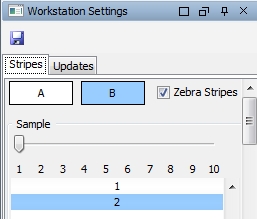
Sample zebra striping
Stripes
You can setup zebra striping.
| » | Check "Zebra Stripes" and select the color of each stripe. |
| » | Click |
Updates
You can show trade and market data updates in different colors.
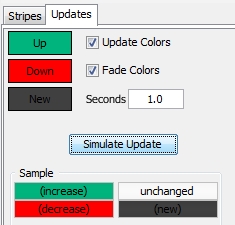
Sample update colors
| » | Check "Update Colors" and select the colors of modified items (up and down), and new items. Enter the number of seconds for the update colors to appear. |
| » | You can click Simulate Update to see how it looks. |
| » | Click |
12. Calypso Workstation - Workstation Menu
The menu items of the Workstation menu are described below.
|
Menu Items |
Description |
|
Save All Reports |
To save the settings of the reports currently open. |
|
Close All Reports |
To close all report results panels. |
|
Close All Panels |
To close all panels. You can then open panels from the Panel menu. |
|
Distribute |
To distribute reports, report plans, drill-down report plans, speed buttons, and window plans to other users. Select the items you want to distribute. Then select user groups and / or individual users, and click Distribute. The selected items will be made available to the corresponding users. |
|
Open CWS on Main Entry start |
This menu item operates as a checkbox. Check to open the Calypso Workstation by default upon starting the Calypso Navigator. |
|
Close Workstation |
To close the window. |
13. Calypso Workstation - Edit Menu
The menu items of the Edit menu are described below.
|
Menu Items |
Description |
|
Undo Redo |
Not used. |
|
Cut |
Not used. |
|
Copy |
To copy a report or folder from the Report Collection window. |
|
Paste |
To paste a copied report or folder to the Report Collection window. |
|
Select All |
To select all the rows in a result panel. |
14. Calypso Workstation - Panel Menu
The menu items of the Panel menu are described below.
|
Menu Items |
Description |
|
Report Collection |
This menu item operates as a checkbox. Check to display the "Report Collection" window, or clear to hide it.
|
|
Drilldown |
This menu item operates as a checkbox. Check to display the "Drilldown" window, or clear to hide it.
|
|
Market Data |
This menu item operates as a checkbox, and only applies to live reports. Check to display the "Market Data" window, or clear to hide it.
|
|
Credit Market Data |
This menu item operates as a checkbox, and only applies to live reports. Check to display the "Credit Market Data" window, or clear to hide it.
|
|
Quotes |
This menu item operates as a checkbox, and only applies to live reports. Check to display the "Quotes" window, or clear to hide it.
|
|
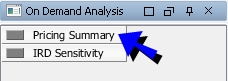
On Demand Analysis |
This menu item operates as a checkbox. Check to display the "On Demand Analysis" window, or clear to hide it.
|
|
Quick Trade |
This menu item operates as a checkbox. Check to display the "Quick Trade" window, or clear to hide it.
|
|
Global Filter |
This menu item operates as a checkbox. Check to display the "Global Server-Side Filter" window, or clear to hide it.
|
|
CWS Settings |
This menu item operates as a checkbox. Check to display the "Workstation Settings" window, or clear to hide it.
|
15. Calypso Workstation - Reports Menu
The menu items of the Reports menu are described below.
|
Menu Items |
Description |
||||||
|
Process All Report Updates |
This menu item operates as a checkbox. Check to activate real-time updates for all reports currently open, or clear to freeze real-time updates. |
||||||
|
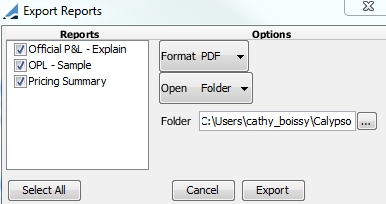
Export Reports |
To export multiple reports at a time.
All reports currently open appear in the Report area.
|
||||||
|
Manage Drilldown Report Plans |
To manage existing drill-down report plans.
|
||||||
|
Manage Saved Report Plans |
To manage existing report plans.
|
||||||
|
On Demand Analysis |
To run risk reports on-the-fly.
|
||||||
|
On Demand Speed Buttons |
To define risk speed buttons.
|
16. Calypso Workstation - Window Plan Menu
The menu items of the Window Plan menu are described below.
The window plan corresponds to the layout of the Calypso Workstation: which windows are opened, their size, and their location.
|
Menu Items |
Description |
||||||||||||
|
<window plan> |
Select an existing window plan. |
||||||||||||
| Save window Plan | To save the window plan currently selected. | ||||||||||||
|
Save Window Plan As |
To save the current window plan as a new window plan. You will be prompted to enter a window plan name. |
||||||||||||
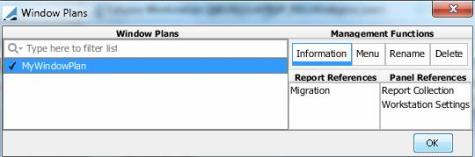
|
Window Plans |
To manage window plans.
The plan currently selected in the Calypso Workstation has a check-mark. You cannot delete it.
|
17. Calypso Workstation - Trade Menu
The menu items of the Trade menu allow opening trade worksheets. Help is available from all trade worksheets for details on capturing and pricing trades.