Pricing Grid
The Pricing Grid offers a user the ability to price trades using variables to predict trade behavior. A rates trader can configure multiple grids for products such as swaps, FRAs, Swap Butterflys and Swap Steepeners. The Pricing Grid is set up to view changes in real-time and to capture trades for these products.
Strategies can be configured in the Pricing Sheet and loaded in the Pricing Grid.
From the Calypso Navigator, navigate to Pricing > Pricing Grid (menu action pricingGrid.PricingGridWindow) to bring up the Pricing Grid.
1. Tour of the Pricing Grid
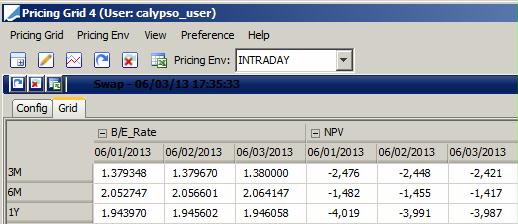
Sample Pricing Grid
By default, the Pricing Grid shows the followings panels:
| • | A Config panel for each pricing grid - It allows adding a pricing grid and specifying its characteristics. |
| • | A Grid panel for each pricing grid - It shows the pricing results - This requires an adhoc Calculation Server to be running. A Calculation Server is part of a Risk Server. |
 Please refer to the Calypso Installation Guide for details on setting up adhoc Risk Servers.
These panels are described below in details.
1.1 Control Bar Buttons
Use buttons in the control bar to calculate a grid, view market data and show/hide a configuration.
Control Bar
![]() - Adds a new Pricing Grid.
- Adds a new Pricing Grid.
![]() - Shows / hides the Config panels.
- Shows / hides the Config panels.
![]() - Opens the Market Data Manager for the Pricing Grid currently selected.
- Opens the Market Data Manager for the Pricing Grid currently selected.
![]() - Calculates all Pricing Grids - This function is also available for each Pricing Grid panel.
- Calculates all Pricing Grids - This function is also available for each Pricing Grid panel.
![]() - Stops all calculations - This function is also available for each Pricing Grid panel.
- Stops all calculations - This function is also available for each Pricing Grid panel.
![]() - Exports Pricing Grid results to Excel - This function is also available for each Pricing Grid panel.
- Exports Pricing Grid results to Excel - This function is also available for each Pricing Grid panel.
2. Config Panel
Select the Config panel of a given Pricing Grid to define its parameters.
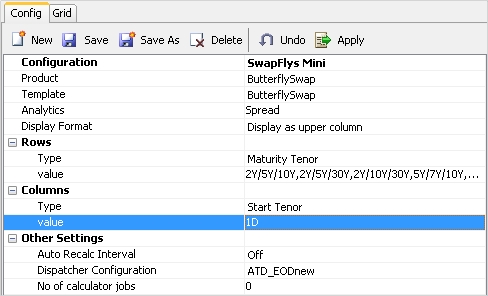
Sample Config panel
| » | Enter the fields described below then click Save to save the pricing grid configuration. You will be prompted to give it a name. The name is displayed in the Configuration field. |
| » | You can then click Apply to display the pricing results in the Grid panel provided a non-official Calculation Server is running. |
See Grid Panel below for details.
| » | Once a Pricing Grid is defined, you can check / uncheck View > Configuration Mode to show / hide the Config panel. |
Fields Details
| Fields | Description | |||||||||
|---|---|---|---|---|---|---|---|---|---|---|
| Configuration |
Pricing grid configuration name displayed upon saving. You can also select an existing pricing grid configuration. |
|||||||||
| Product |
Select the product that you want to price. Products correspond to Pricing Sheet out-of-the-box strategies, or custom strategies.
|
|||||||||
| Template |
Select the strategy template that you want to use to model the trades of the selected product. To create a strategy template, configure a trade for a given strategy in the Pricing Sheet, and save it as a strategy template.
Example: You can save a template for the ButterflySwap strategy in the Pricing Sheet, and it will be available for the ButterflySwap product in the Pricing Grid. It will not be available however for the Swap product in the Pricing Grid. You would need to create a template for the Swap strategy. |
|||||||||
| Analytics | Select the pricing results you want to compute - They are represented by pricer measures. | |||||||||
| Display Format |
Select the order of the display:
|
Field Details - Rows / Columns / Z Axis
The Pricing Grid will display the selected analytics for each combination of Rows / Columns / Z Axis values.
| Fields | Description | ||||||||||||
|---|---|---|---|---|---|---|---|---|---|---|---|---|---|
|
Type |
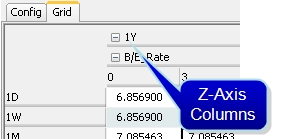
Select the type of data for which you want to compute pricing results as rows, columns, or Z-Axis. The choices depend on the selected product type:
For swaptions, there is a Z Axis as well where a user can select the third axis. A user can display the Z-Axis as a column or as, a page. There will be a page for each value of Z-Axis. |
||||||||||||
|
value |
Enter the values for which you want to compute pricing results.
For butterfly swaps, you need 3 tenors to identify each trade: 1M/3M/6M, 1Y/5Y/7Y, etc. For swap spreads, you need 2 tenors to identify each trade: 1M/1M, 1Y/3Y, etc.
|
Field Details - Baseline Settings
Selecting analytics with (Diff) will bring up a Baseline Settings details section. It allows calculating the difference between the current pricing environment and a baseline pricing environment, or the difference between a baseline valuation date and the current valuation date for the same pricing environment. Diff values are displayed in basis points.
| Fields | Description |
|---|---|
| Offset | You can enter a tenor or a specific date to determine the baseline valuation date. |
| Time of Day | You can enter a time to set the baseline valuation time. |
| Baseline PE |
You can select a baseline pricing environment, or "From Grid" to use the current pricing environment. The Grid panel will display the baseline information, if any. |
| Holidays | Select the holiday calendar to roll the baseline valuation date as needed. |
| DateRoll | Select the method to roll the baseline valuation date as needed. |
Field Details - Other Settings
| Fields | Description |
|---|---|
| Auto Recalc Interval |
Interval for auto recalculation of the grid. Set to 10s, 15s, 30s, 1m or Off. A Setting an auto recalc interval will require the use of a Dispatcher that is specified to support a Pricing Grid. The available dispatcher drop down will only include dispatcher configurations specified for use and the Pricing Grid will not function without the dispatcher. If "Off" is selected, the Pricing Grid will run without a specified dispatcher. The available dispatcher drop down will include any configurations the user has access permissions to. Auto-recalc icons will not be displayed if recalculation is not configured. If auto pricing is configured and "Stop GridCalculation" is clicked, red auto-recalc button will be displayed. If configured and running, a green calc button will be displayed. |
| Auto Recalc Dispatcher Config |
You can select a dispatcher configuration to compute the pricing results on multiple machines. DEFAULT is the default dispatcher configuration defined in the User Defaults attribute "Default Pricing Grid Auto Update Dispatcher". Choose default or from a list of configured and saved configurations. When specifying a Pricing Grid Dispatcher, you must add it as supporting a Pricing Grid. Add "Support Pricing Grid Auto Update" as a parameter in the Dispatcher Config window and set the value to "true". This will add the configuration as an option in User Defaults.
The number of trades per job in the dispatcher is based on the environment property DIST_SIZE (default is 500). Specifying separate Pricing Grid dispatchers improves performance by dedicating resources separate from others used in processing calculations for other pricing or analysis applications. |
| No of calculator jobs |
Number of cells each calculator job will process. Example: Setting this value to 5 on a grid with 200 cells will calculate 50 cells per job. |
3. Grid Panel
The Grid panel is displayed by default. It shows the pricing results based on the Pricing Grid configuration.
It requires an adhoc Calculation Server to be running.
The grid displays the configured measures by maturity, start date, etc. Z-axis measures appear above column measures.
3.1 Create a Trade from the Pricing Grid
You can create a trade from the Pricing Grid.
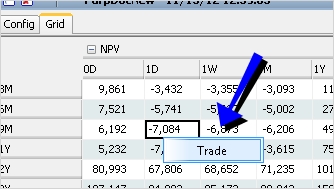
Trade menu action in a grid
| » | Right-click a cell, and choose Trade. It will bring up the corresponding strategy in Pricing Sheet, and the trade will be populated using the corresponding strategy template. |
3.2 Viewing Pricing Results
When you click Apply in the Config panel, or you click the green icon, the pricing results are computed and displayed. You can filter the results as needed.
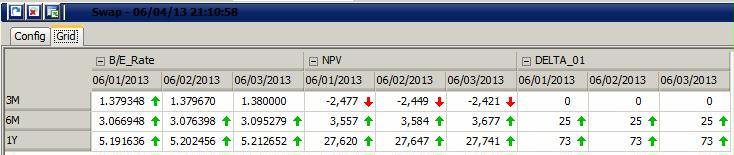
As market data change in real-time, or as you reprice the grid, the results are updated with an up or down indicator.
You can stop the computation at any time by clicking the ![]() icon.
icon.
The menu items of the Preference menu allow configuring the display.
| Menu Items | Description |
|---|---|
| Set Precision |
You can set the precision for each pricer measure. |
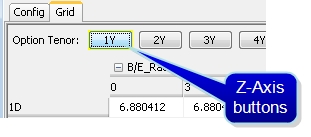
| View Z-Axis filter using buttons |
Only applies if Z-Axis "Display Format" is set to "Display as page". When checked, each page can be accessed by a button.
When unchecked, each page can be accessed using a drop down list, or arrows.
|
| Use Zebra striping |
When checked, every other row appears with a white / blue background. When unchecked, all rows appear with a white background. |
| Show Row / Column Filter | When checked, the rows / columns headings are displayed, and filtering is enabled. |
4. Market Data Panel
You can choose View > Show/Hide Market Data Panel to show / hide the Market Data panel. It shows the market data used for pricing.
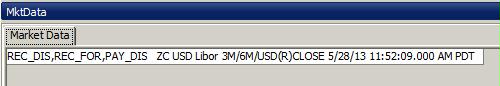
You can double-click a market data to view its details, or you can click ![]() to open the Market Data Manager.
to open the Market Data Manager.
See Market Data Manager for details.
You can choose Pricing Env > Check to check that all required market data are available in the pricing environment.