Seasonality Curve
From the Calypso Navigator, navigate to Market Data > Interest Rate Curves > Seasonality Curve (menu action marketdata.CurveSeasonalityWindow).
This topic describes creating seasonality curves to apply seasonal adjustments to inflation curves.
You can only create a simple seasonal curve from offset points.
There is no need to associate the seasonality curve with the pricer configuration.
|
Seasonality Curve Quick Reference The seasonality curve is created for a given inflation index – Inflation indices are created using Configuration > Interest Rates > Rate Index Definitions from the Calypso Navigator. The index type is Inflation and in the attributes, the attribute IndexCalculator is set to InflationIndexKerkhof. Curve Generation 1. Click New to start a new curve. 2. Select the quote instance to use in the curve generation (CLOSE, LAST, or OPEN). If you select the LAST instance, you can use real-time quotes in the curve. Select a real-time source and the RT checkbox at the bottom of the curve application. 3. The Current checkbox is selected by default, meaning that when you save the curve, the system timestamps the curve with the current date and time. Clear the Current checkbox to enter a back-dated curve. You can modify the date and time fields. 4. Definition Panel — Select the following to define the curve: currency, index, seasonality adjustment type, interpolator, start month, start year, and number of years. 5. Click Generate Dates to generate the points, and enter the seasonal adjustments in %. 6. Click Save, enter a name for the curve, and click OK. |
1. Creating a Seasonality Curve
1.1 Definition Panel
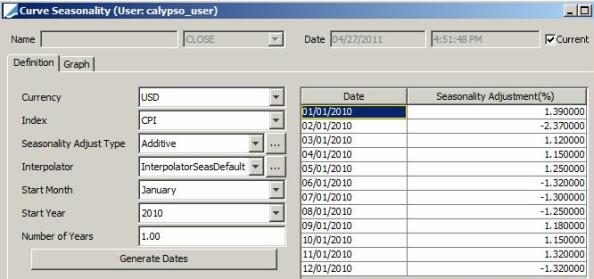
| » | Select a currency and a rate index. |
| » | Select the seasonality adjustment type: Only Additive is supported. |
Additive – The seasonality adjustments will be added to the index levels of the inflation curve - The sum of all seasonality adjustments over one year should be equal to "0".
| » | Select the interpolator as needed, “NONE” or “InterpolatorSeasDefault”. The interpolator InterpolatorSeasDefault uses the most recent 12 months of values to re-use for all future dates. So, last value for January is used for all January dates in the future. |
| » | Select a Start Month, a Start Year, and enter a number of years. Then click Generate Dates to generate seasonality adjustments dates. |
| » | Enter the seasonality adjustment percentages for each date. |
Graph Panel
You can view a bar chart in the Graph panel.
1.2 Save Curve
Click Save at the bottom of the curve window. Enter a name for the curve, and click OK.
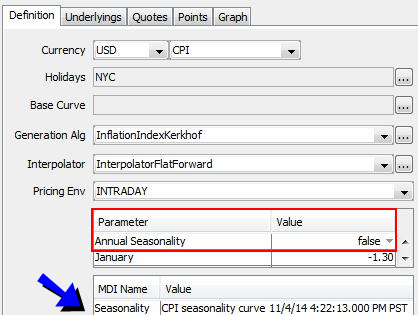
2. Sample Seasonality Curve Usage
A seasonality curve can be associated with an inflation curve if the parameter "Annual Seasonality" is false.