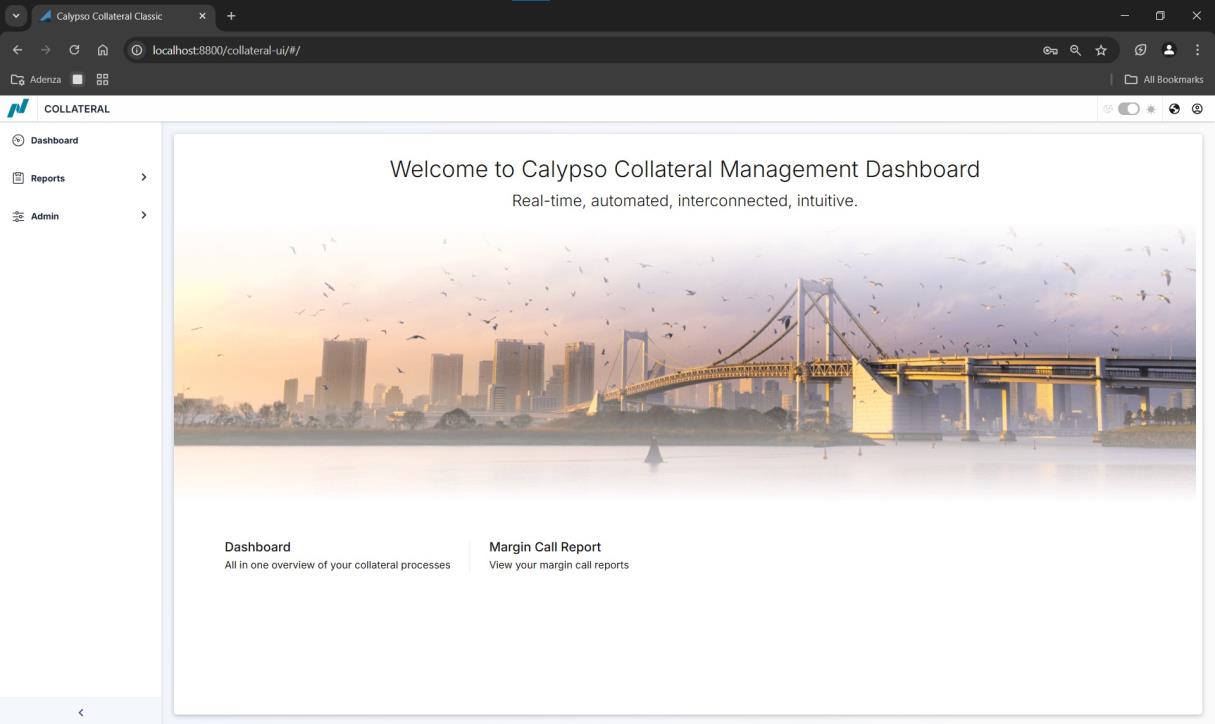
Collateral Dashboard Web-UI
The Collateral Dashboard is a Web-UI dashboard that can be used in conjunction with the on-premise Collateral Management workstation and collateral processing.
It is designed to give an overview of the Collateral Management process and highlight any critical items that may need to be addressed, such including margin calls tracking metrics, dispute tracking metrics and various reports.
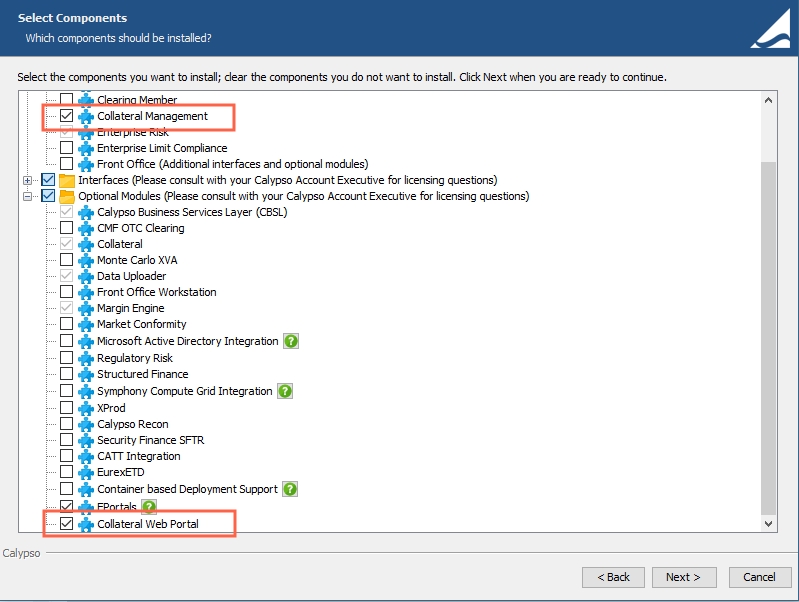
1. Installation
The Collateral Dashboard is installed as part of the Calypso Installer when you select Collateral Web Portal in the installer under Optional Modules. The Collateral module is installed when you select Collateral Management in the installer under Solution.
 Please refer to the Calypso Installation Guide for complete details.
When you run Execute SQL as part of your installation, all Collateral and Collateral Dashboard files will be already loaded, and any required upgrade process will be performed.
1.1 Database Upgrade
While running executeSql.bat, all the database files should be loaded automatically. Make sure you add the UserPreferencesServiceSchemaBase.xml file if not already loaded.
1.2 Access Permissions
The following Functions should be given Read/Write access:
| • | COLLATERAL_MANAGERRole |
| • | CORE_SERVICE_MANAGERRole |
Filtering of all Dashboard and Reports services with a user configured processing org as implicit is restricted with the access permission ViewOnlyProcessingOrgStaticData.
1.3 Starting the Collateral Dashboard
Step 1 - Start Servers
From the Startup menu in the Calypso folder, start the following servers (in order) before starting Calypso Navigator:
| • | Auth Server |
| • | Discovery Server |
| • | Gateway Server |
| • | Event Server |
| • | Data Server |
| • | Engine Server(in order to run the necessary engines related to Margin Call generation) |
| • | Risk Server(in order to access the required Market Data) |
| • | Shared Services |
| • | Calypso Services Collateral Server |
For more information on the Discovery Server, Gateway Server and Shared Services, refer to the API Gateway section of the Calypso Install Guide.
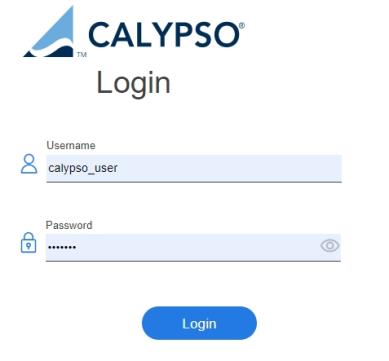
Step 2 - Web URL
After all servers have been started, log in to the Collateral Dashboard using one of the URLs below.
If SSL is enabled: https://localhost:8801/collateral-ui/
If SSL is not enabled, the URL location is: http://localhost:8800/collateral-ui/
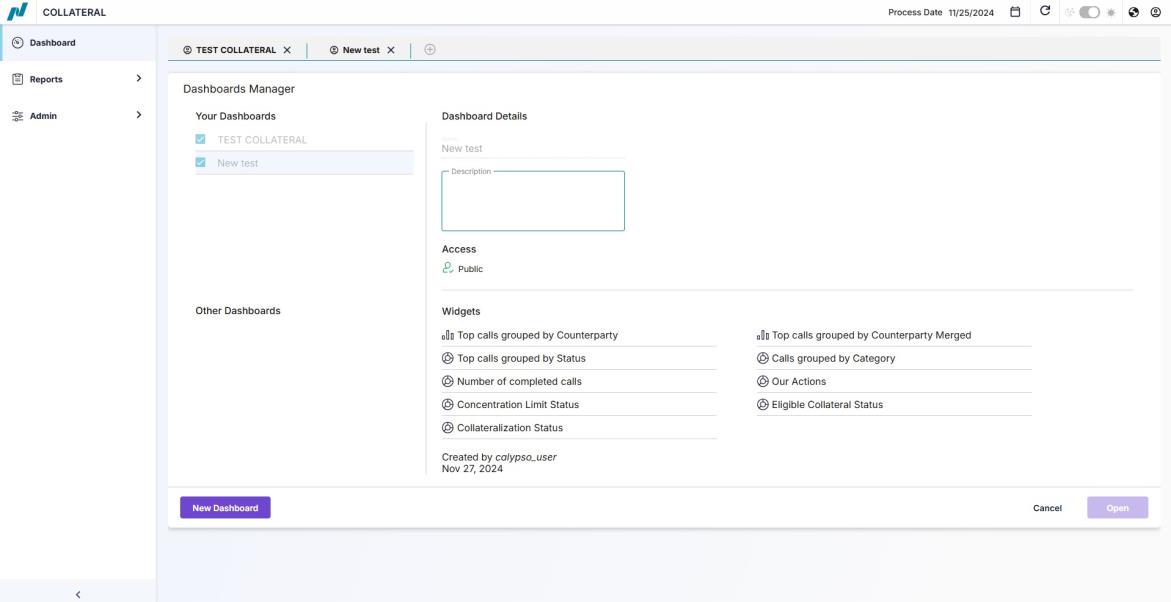
You existing dashboards are displayed.
Example:
2. Creating Dashboards
2.1 New Dashboard / Edit Dashboard
To create a new dashboard, select Dashboard and click  .
.
If you already have existing dashboards, click and then select New Dashboard.
It brings up the New Dashboard window.
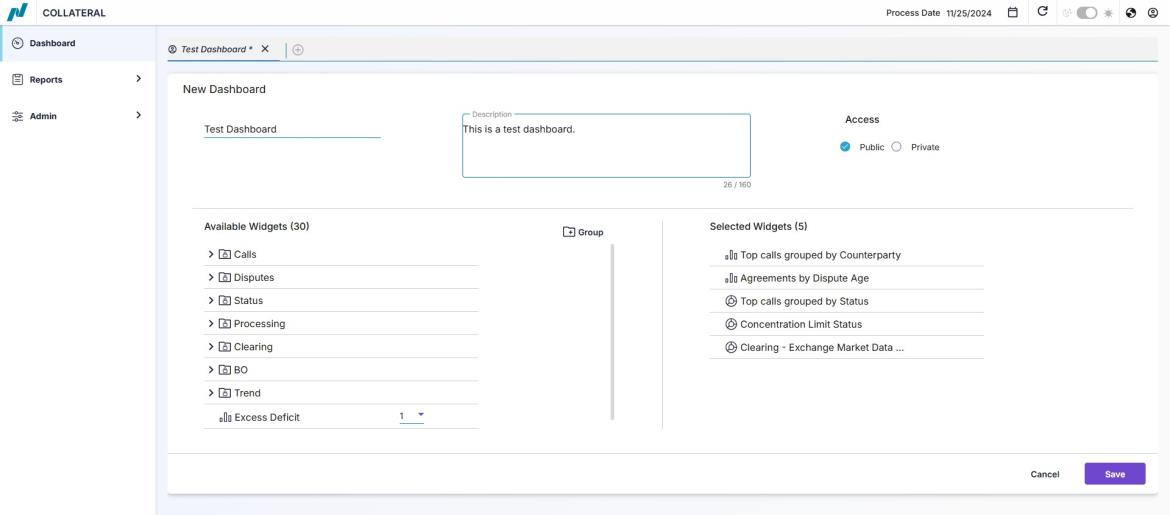
| » | Enter the Dashboard name and description. |
| » | Choose the access permissions for the dashboard - Public or Private. |
-
Public: The dashboard is accessible to all users.
-
Private: The dashboard is accessible only to the creator of the dashboard.
| » | Select the widgets you want to display - The widgets are categorized into 7 categories. Select the dropdown option beside a category to see the list of widgets. |
| » | Click Save. |
Once a dashboard is open, you can modify it by clicking  and choosing the desired option.
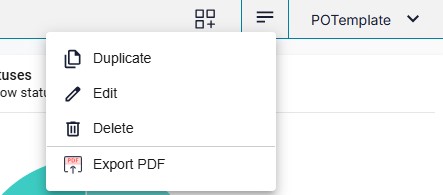
| » | You can click to create a duplicate of a dashboard. to create a duplicate of a dashboard. |
| » | You can click  to delete a dashboard. to delete a dashboard. |
| » | You can click to modify the dashboard name and description. to modify the dashboard name and description. |
| » | You can click  to export the selected dashboard to a PDF file and download it. to export the selected dashboard to a PDF file and download it. |
| » | You can click  to add and configure widgets. to add and configure widgets. |
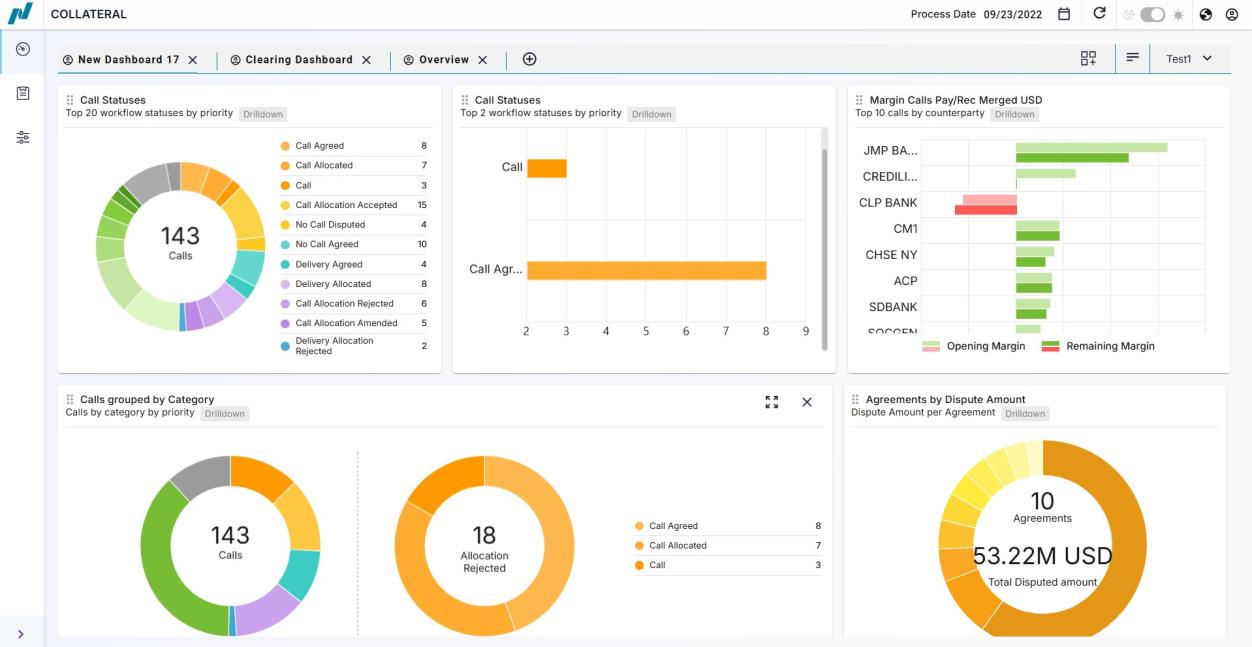
3. Dashboard Widgets
The Widget Library is a pre-configured list of widgets. Each widget displays a certain kind of chart. Some widgets can display the same type of information but in different formats. Within some widgets, there is a degree of configuration available, such as statuses to include, maximum number of results, etc.
The available widgets are divided into seven categories:
| » | Call |
| » | Dispute |
| » | Status |
| » | Processing |
| » | Clearing |
| » | BO |
| » | Trend |
3.1 Call Widgets
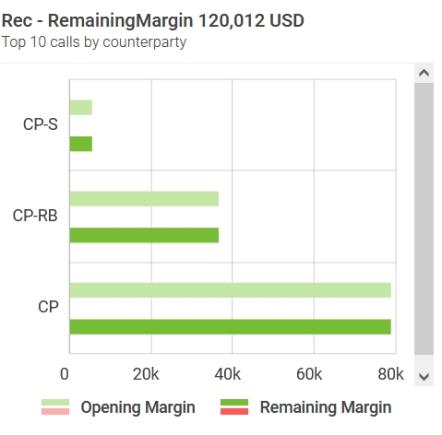
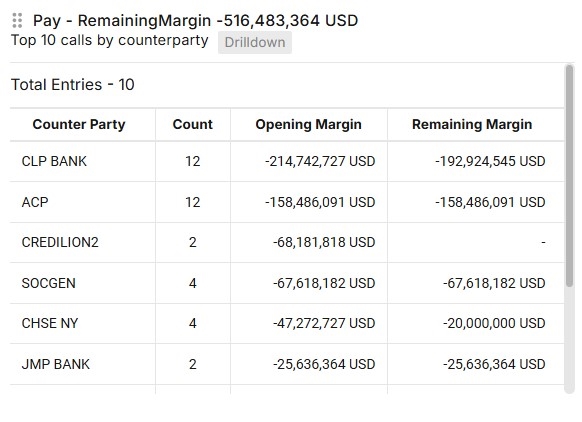
Top Calls grouped by Counterparty
This widget displays either the top Pay or Receive remaining margin grouped by counterparty. It is possible to display Opening Margin or Remaining Margin or both.
There are two versions of this widget, a bar chart designated by![]() the icon and a graph designated by the
the icon and a graph designated by the![]() icon.
icon.
Bar chart example:
Graph example:
You can click ![]() to configure the widgets.
to configure the widgets.
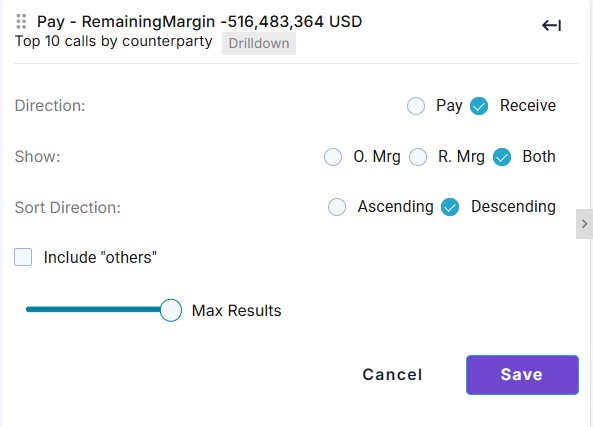
| • | Include Others - Toggle to include the Others category that contains all the counterparties beyond the first 10 counterparties. |
| • | Max Results - Select the maximum number of counterparties contained in the widget. The maximum is 10. |
| • | Direction - Choose either pay or receive |
| • | Show - Choose to display either Opening (Global Required) Margin, Remaining Margin or both. |
| • | Sort Direction - Choose Ascending or Descending. |
| • | Click Save. |
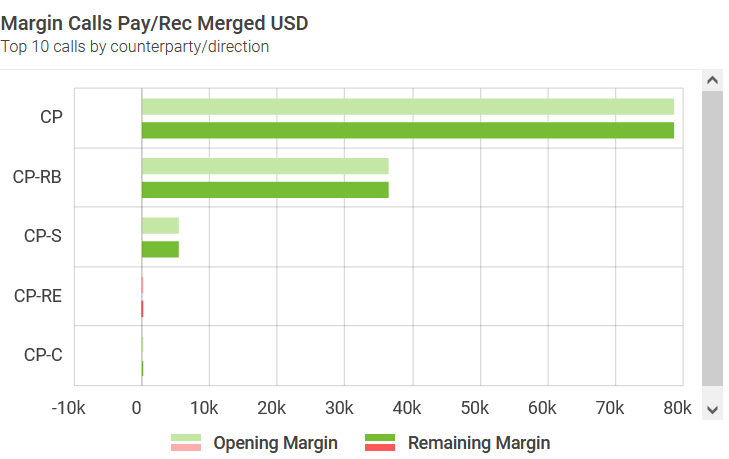
Top Calls grouped by Counterparty Merged
This widget allows you to view the Pay and Receive calls per counterparty and show the largest net items.
Example:
You can hover over a line display more details.
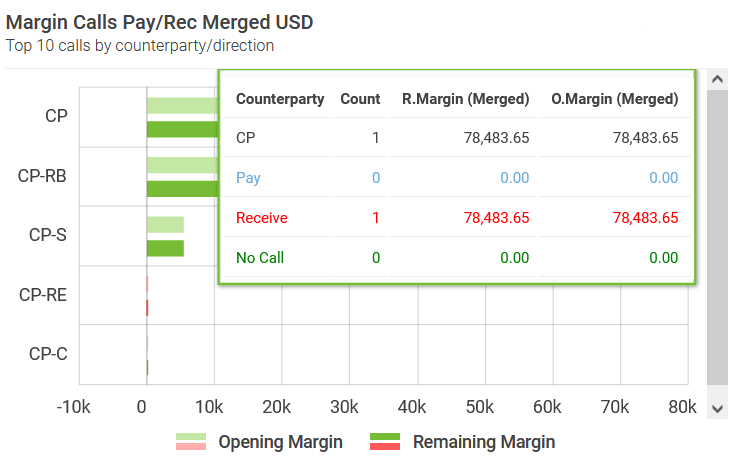
You can click ![]() to configure the widget.
to configure the widget.
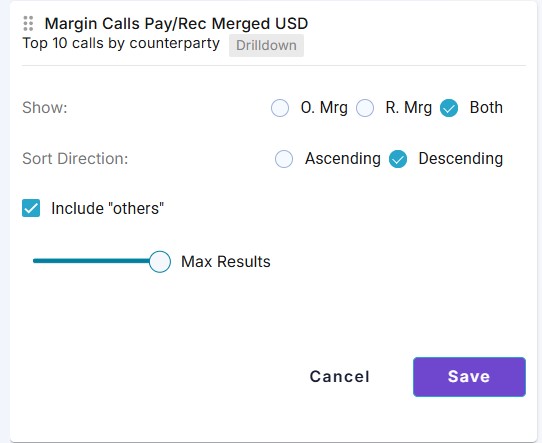
| • | Include Others - Toggle to include the Others category that contains all the counterparties beyond the first 10 counterparties. |
| • | Max Results - Designate the maximum number of counterparties contained in the widget. The maximum is 10. |
| • | Show - Choose to display either Opening (Global Required) Margin, Remaining Margin or both. |
| • | Sort Direction - Choose Ascending or Descending. |
| • | Click Save. |
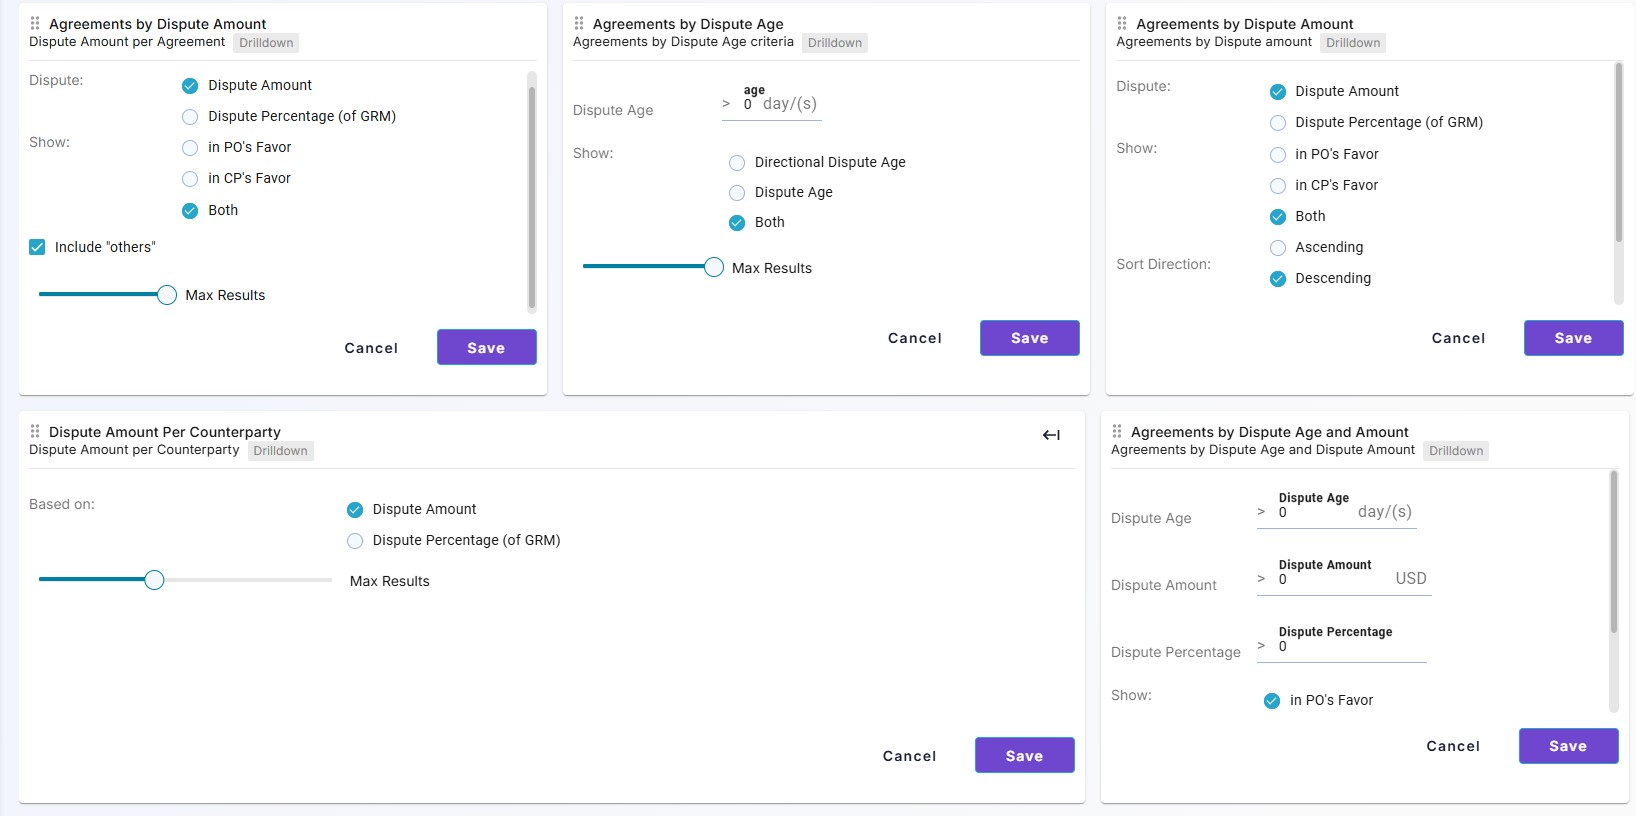
3.2 Dispute Widgets
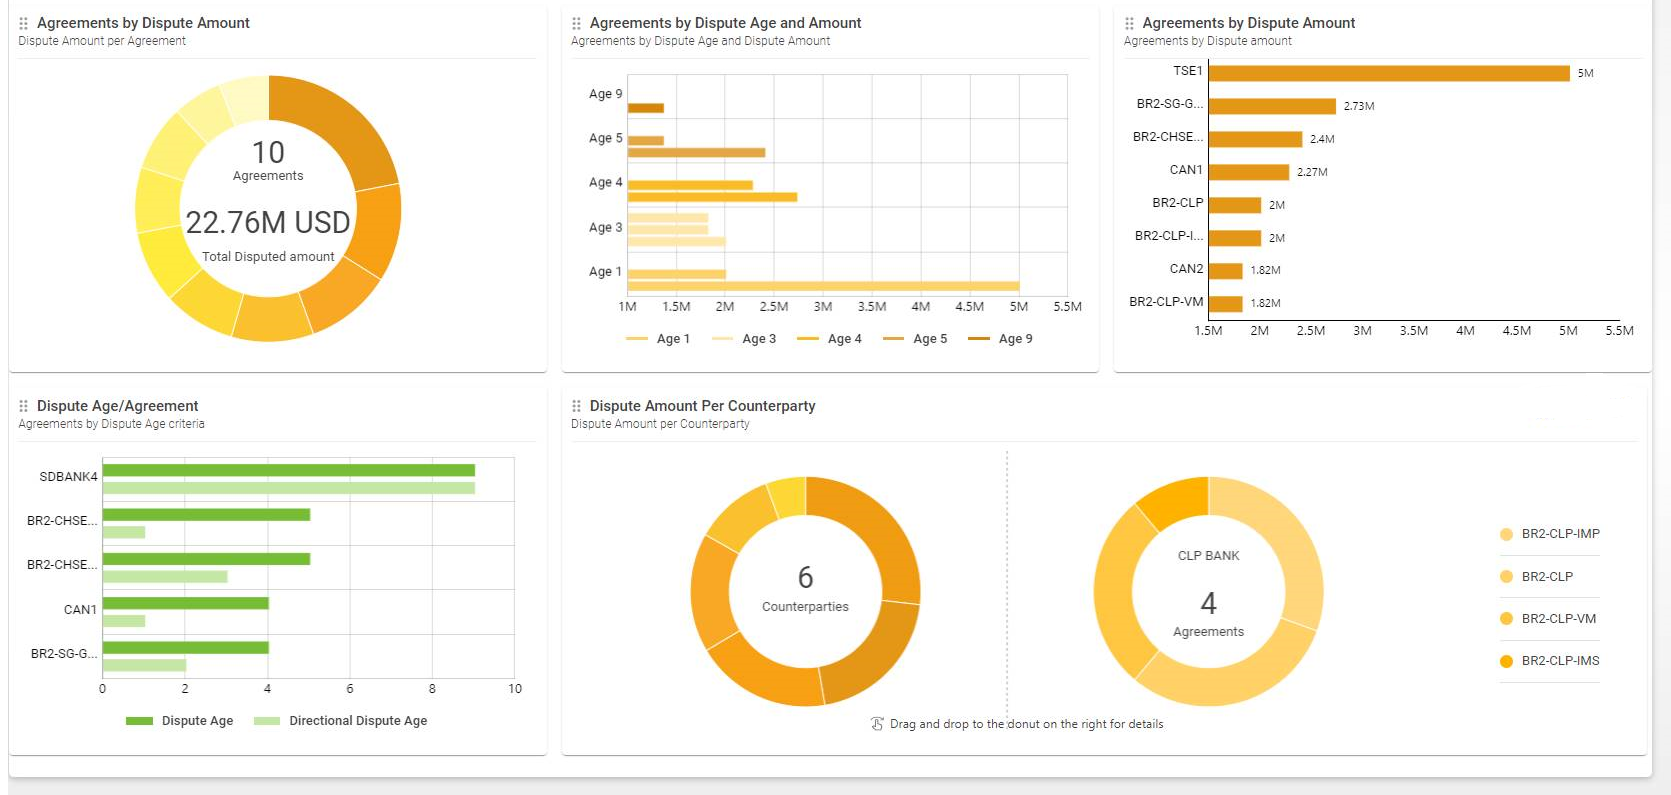
For the widgets- Agreements by Dispute Age and Amount and Dispute Age/Amount, you can zoom out the charts by hovering the cursor over the widget and clicking  .
.
You can click  to configure the widgets.
3.3 Status Widgets
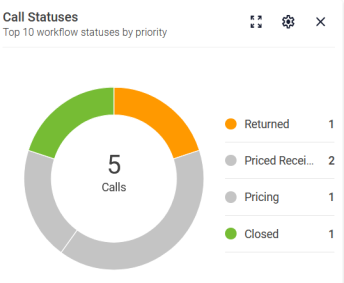
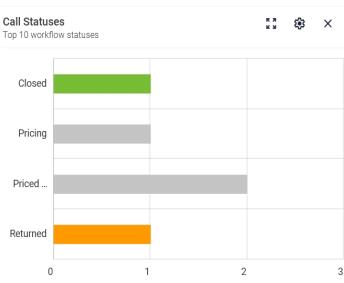
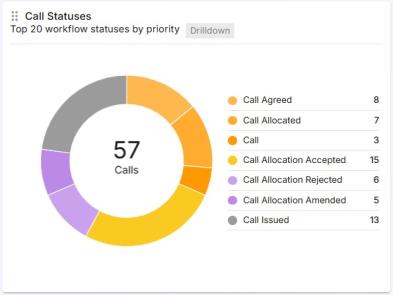
Top calls grouped by Status
The Top Calls Grouped by Status widgets display the number of calls in a specific status. There are two versions of this widget, a pie chart designated by ![]() and a graph designated by
and a graph designated by ![]()
Pie Chart Example:
Graph example:
You can click![]() to configure the widgets.
to configure the widgets.
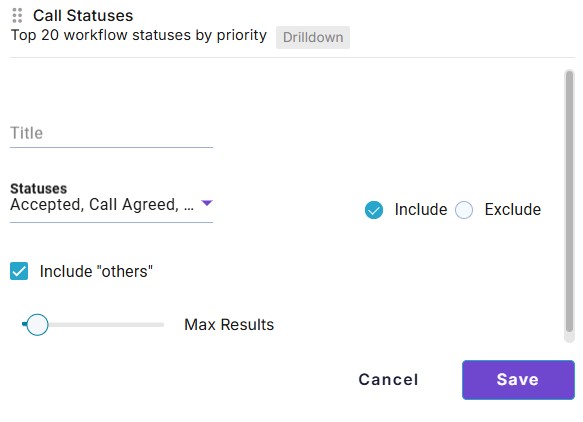
| • | Title - Enter a name to identify the widget. |
| • | Include Others - Toggle to include the Others category that contains all the status codes not selected under Statuses. |
| • | Max Results - Select the maximum number of statuses contained in the widget. For example, if 3 is selected, only the three most pressing statuses will be displayed based on the category they are assigned to. |
See Defining Categories for details.
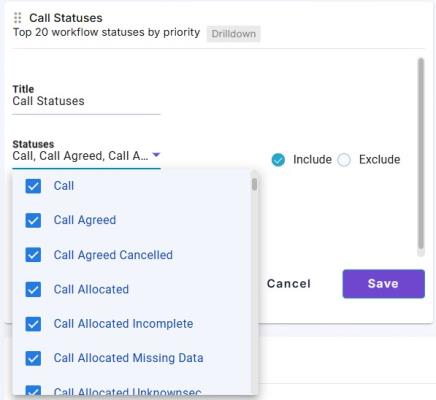
| • | Statuses - Select the status codes you want to Include or Exclude, depending on the Include and Exclude radio buttons. |
Regardless of the statuses chosen here, no more than the Max Number of statuses will be displayed in the widget.
| • | Click Save. |
Example:
This configuration can be used to create status widgets for different purposes. For example, you can create a widget for all of the Receipts (my Calls), by selecting the Call statuses.
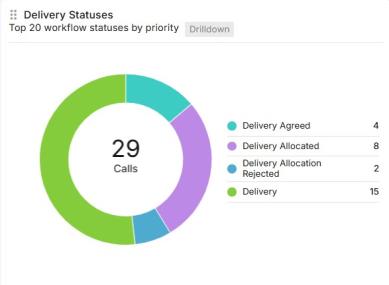
Or, you could create a widget for all of the Payments (my Deliveries), by selecting all of the Delivery statuses.
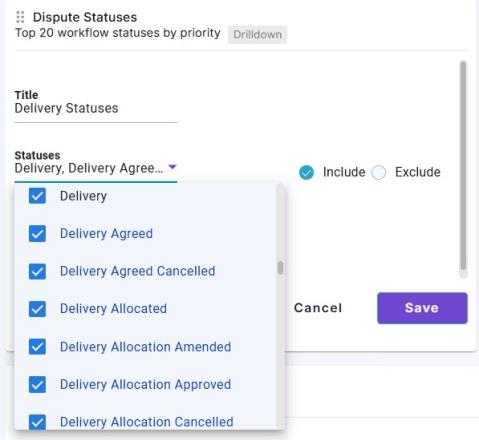
The dashboard for these widgets would like below:
This widget displays the calls by category, based on their status.
See Defining Categories for details.
If a status is not mapped to a category, then any calls in these statuses are included as the last category.
Example:
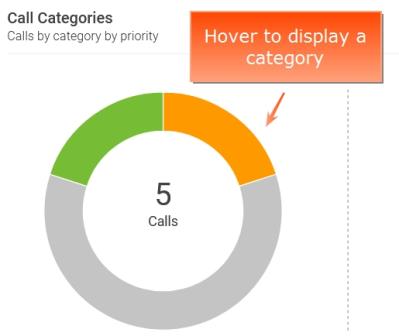
There is no additional configuration for this widget.
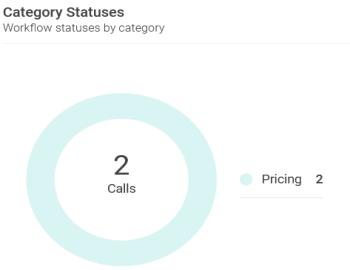
This widget displays the Number of Calls that are in Completed category, based on their status.
See Defining Categories for details.
Example:
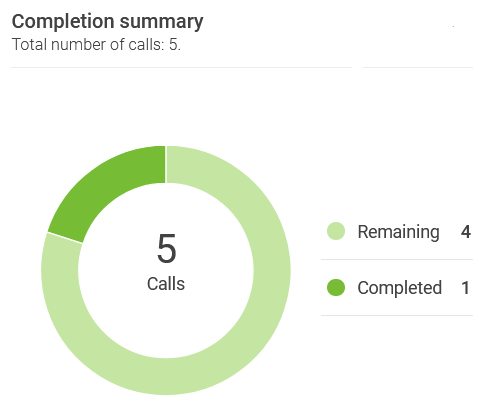
There is no additional configuration for this widget.
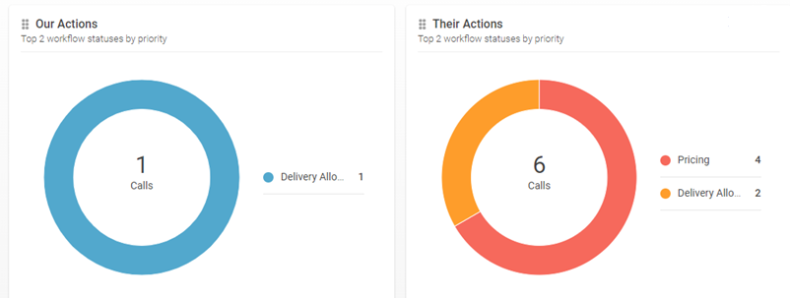
Top Calls Grouped by Next Owner Action
This widget displays the next owner action for every status included in a category.
See Defining Categories for details.
Example:
You can click ![]() to configure the widgets.
to configure the widgets.
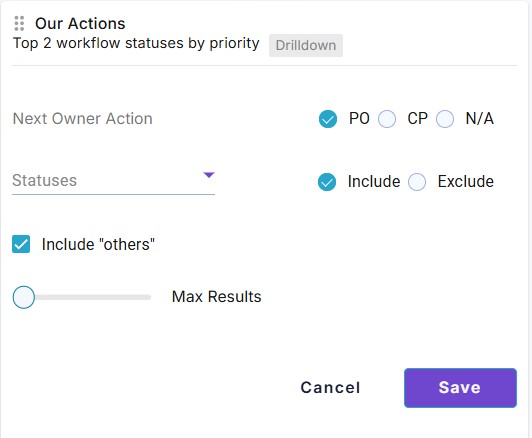
| • | Include Others - Toggle to include the Others category that contains all the status codes not selected under Statuses. |
| • | Max Results - Select the maximum number of statuses contained in the widget. For example, if 3 is selected, only the three most pressing statuses will be displayed based on the category they are assigned to. |
See Defining Categories for details.
| • | Statuses - Select the status codes you want to Include or Exclude, depending on the Include and Exclude radio buttons. |
Regardless of the statuses chosen here, no more than the Max Number of statuses will be displayed in the widget.
| • | Next Owner Action - Select the Owner for the display. PO (us), CP (them) or N/A (no action required) |
When PO is chosen, the widget title is Our Actions.
When CP is chosen, the widget title is Their Actions.
When N/A is chosen, the widget title is No Action Required.
| • | Click Save. |
Statuses Based on Category
This widget allows viewing the calls for a given category and associated statuses.
You can click ![]() to configure the widgets.
to configure the widgets.
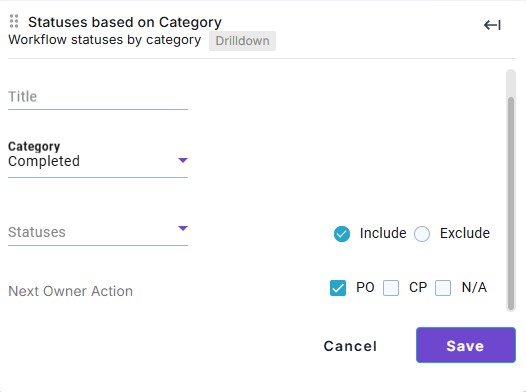
| • | Title - Enter a title to identify the widget. |
| • | Category - Select the category. |
See Defining Categories for details.
| • | Statuses - Select the status codes you want to Include or Exclude, depending on the Include and Exclude radio buttons. |
| • | Next Owner Action - Select the next owner action. |
| • | Click Save. |
3.4 Processing Widgets
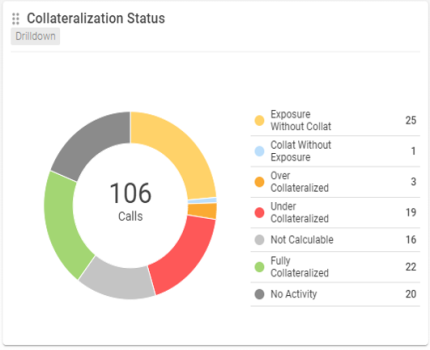
Collateralization Status Widget
This widget displays a pie chart of the various statuses associated to a collateral's exposure and sufficiency. All the statuses are represented by a specific color.
You can click ![]() to configure the widget.
to configure the widget.
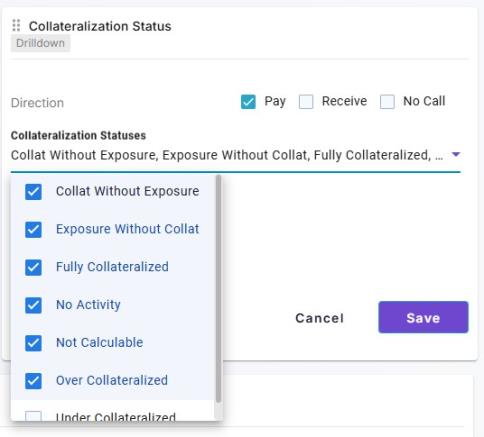
| • | Direction - Select the direction of the contract. |
| • | Collateralization Statuses - Select the required statuses to be displayed. |
| • | Click Save. |
Concentration Limit Status Widget
This widget displays whether the concentration limit of the collateral contract has been breached or not.
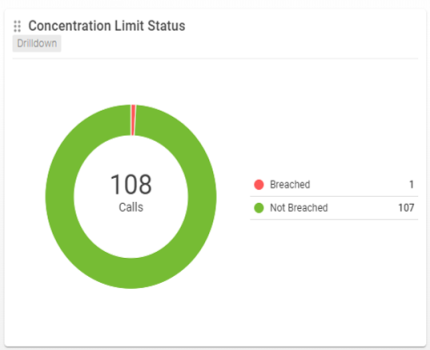
There is no additional configuration for this widget.
This widget displays whether the collateral held on the contract is eligible or not.
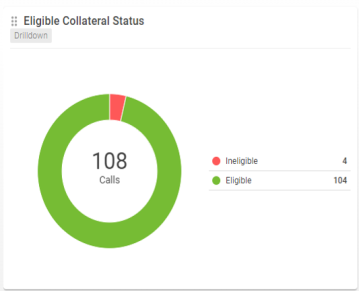
There is no additional configuration for this widget.
3.5 Trend Widgets
To activate Trend widgets, please check COLLATERAL_TREND Scheduled Task.
Trend Dispute Status Widget
This widget displays the volume of disputed status entries over a selected period of time.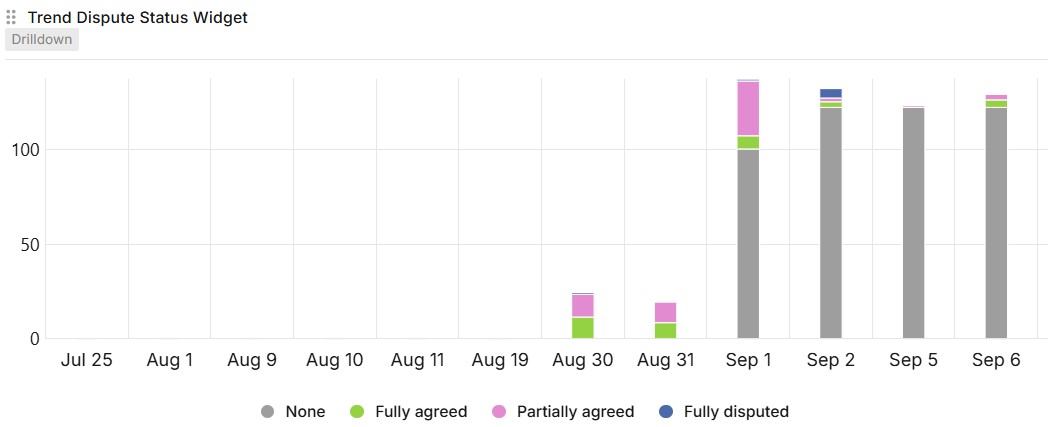
You can click ![]() to configure the widgets.
to configure the widgets.
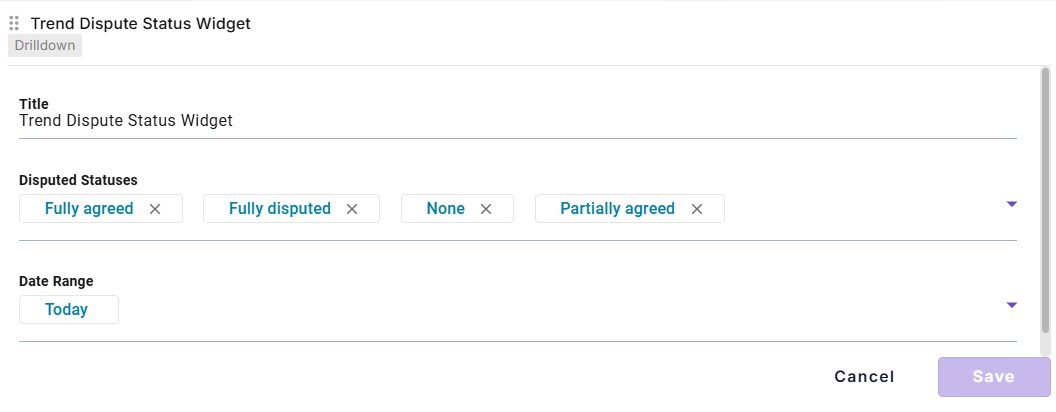
| • | Disputed Statuses - Select the statuses to be displayed. |
| • | Date Range - Select the date range for the data to be generated. |
| • | Click Save |
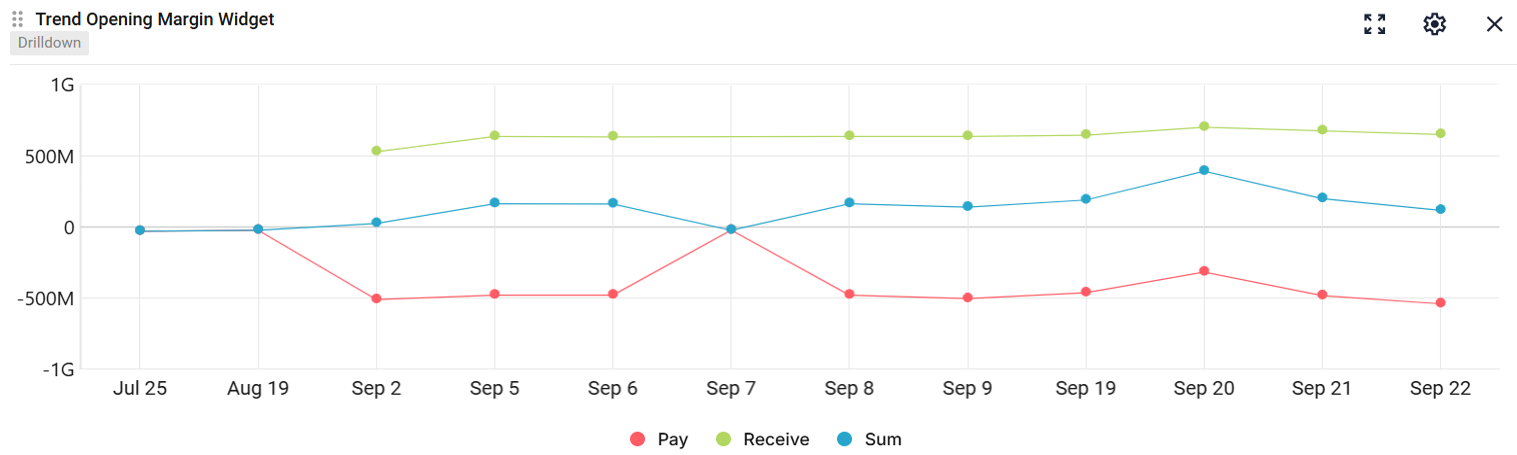
Trend Opening Margin Widget
This widget displays the trend for Global Required Margin over a period of time.
You can click ![]() to configure the widgets.
to configure the widgets.
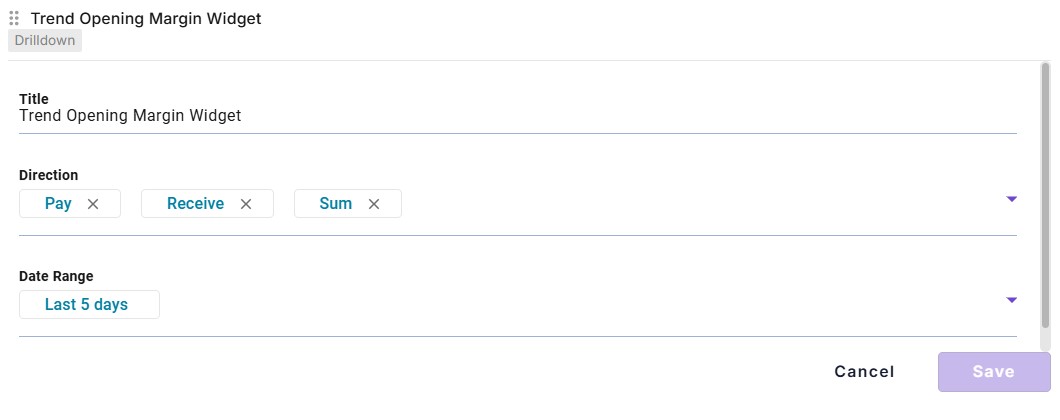
| • | Direction - Choose the direction of entries - Pay, Receive or Sum. |
| • | Date Range - Select the date range for the data to be generated. |
| • | Click Save |
DIspute Rate by Direction Widget
This widget displays the trend for dispute rates over a period of time.
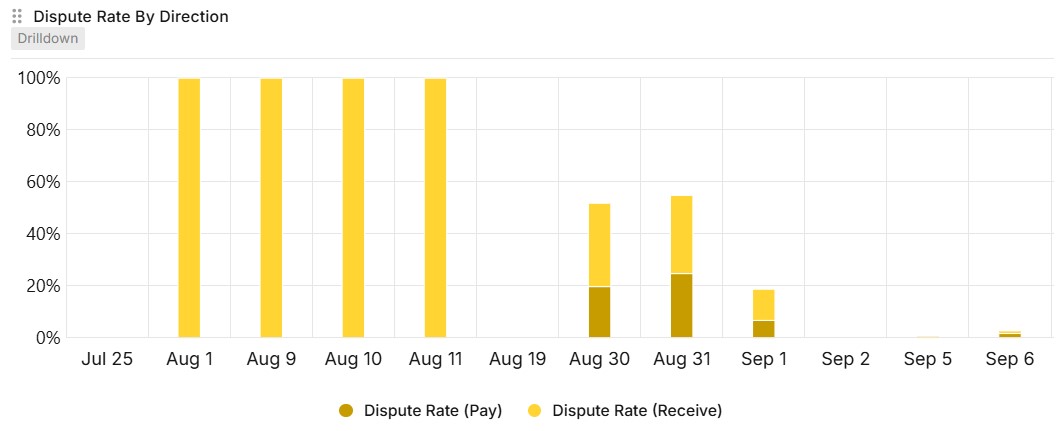
You can click ![]() to configure the widgets.
to configure the widgets.
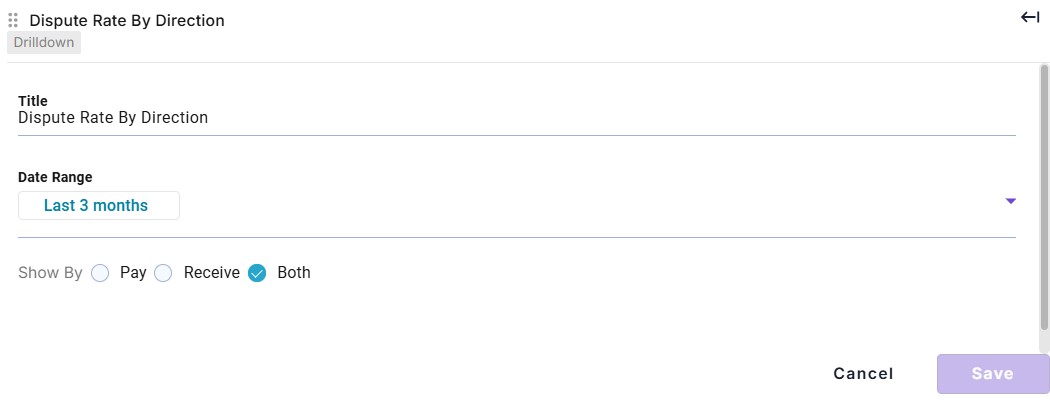
| • | Date Range - Select the date range for the data to be generated. |
| • | Show By - Select the direction - Pay, Receive or Both. |
| • | Click Save |
4. Defining Templates
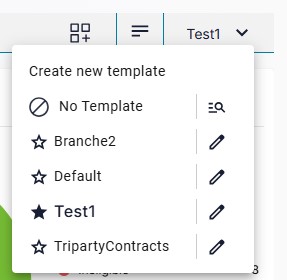
You can save a number of selection criteria at the Dashboard level by defining templates using Create new template.
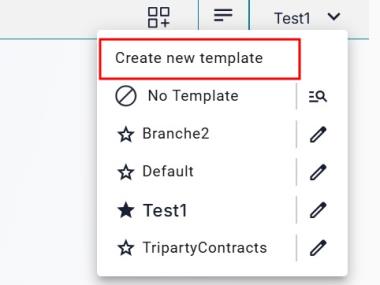
It brings up the Templates window.
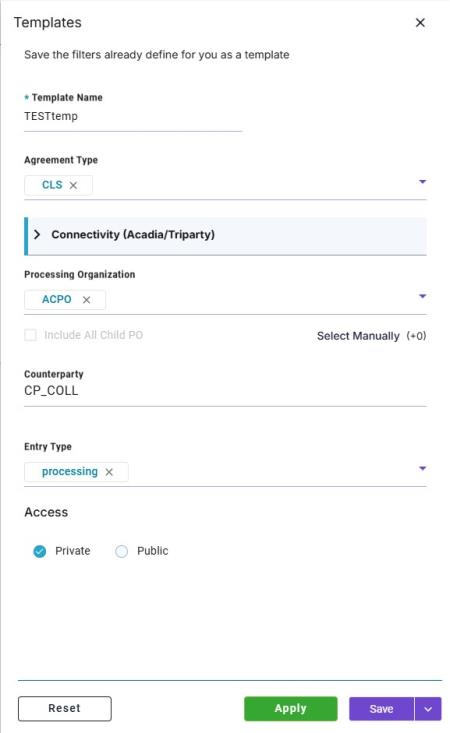
| » | Select the criteria you want to use to select margin call contracts as needed. They are described in the following table- |
|
Criteria |
Description |
||||||
|---|---|---|---|---|---|---|---|
|
Template Name |
Enter a name to identify the template. |
||||||
|
Agreement Type |
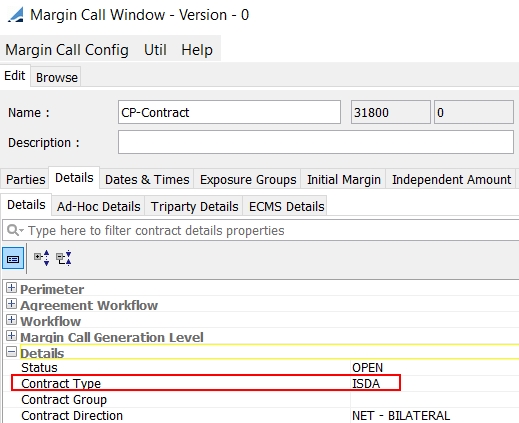
Select the types of agreements, or all if not selected. Agreement types are defined in the domain "legalAgreementType" and set on Margin Call Contracts in the field Contract Type.
|
||||||
|
Connectivity (Acadia/Triparty) |
Select the types of connectivity: Acadia only, Triparty only or ALL. |
||||||
|
Processing Organization |
Select the processing orgs, or all if not selected. |
||||||
|
Counterparty |
Select the counterparties, or all if not selected. |
||||||
|
Entry Type |
Select the entry types, or all if not selected. |
||||||
|
Access |
Select the preferred access permission for your template - Public or Private.
|
| » | Click Save to save the template. |
You can set a default template by clicking the star.
5. Reports
5.1 Margin Call Report
Dashboard Drill Down
For the widgets above that are based on the Margin Call Entry, the Drill Down Navigation is to the Margin Call Report - filtered for the items that are displayed in the relevant chip/slice/bar in the widget.
For example, click on"Call":
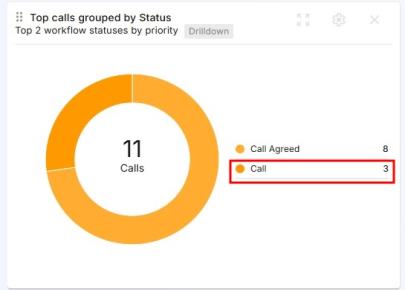
The associated Margin Call report:
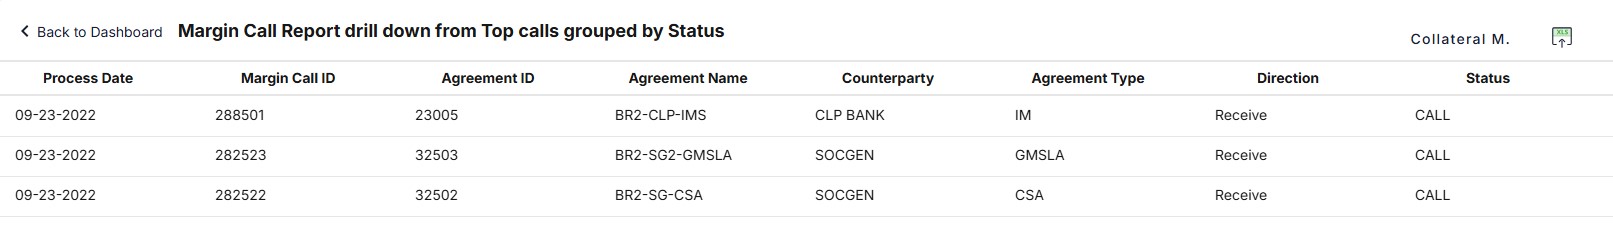
| » | On clicking Collateral M., you will be redirected to the core Collateral Manager window for the respective contract. |
Margin Call Report
If you select Reports > Margin Call, the full report is displayed by default.
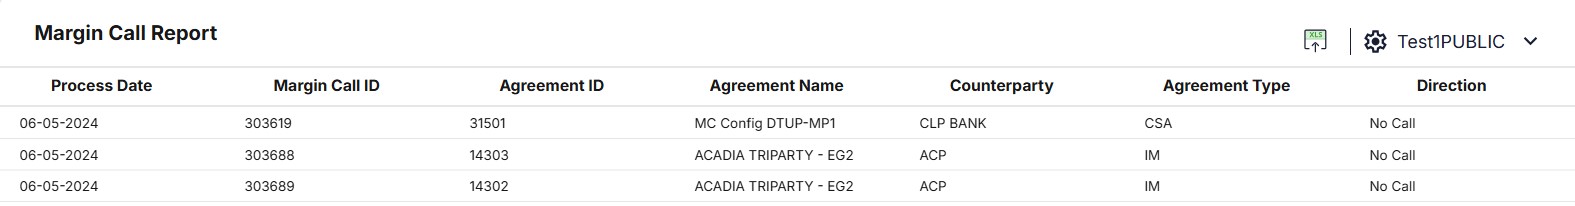
You can click Create New Template to specify search criteria and save the template.
You can click  to export the report.
5.2 Dispute Report
Select Reports > Dispute to display the Dispute report.
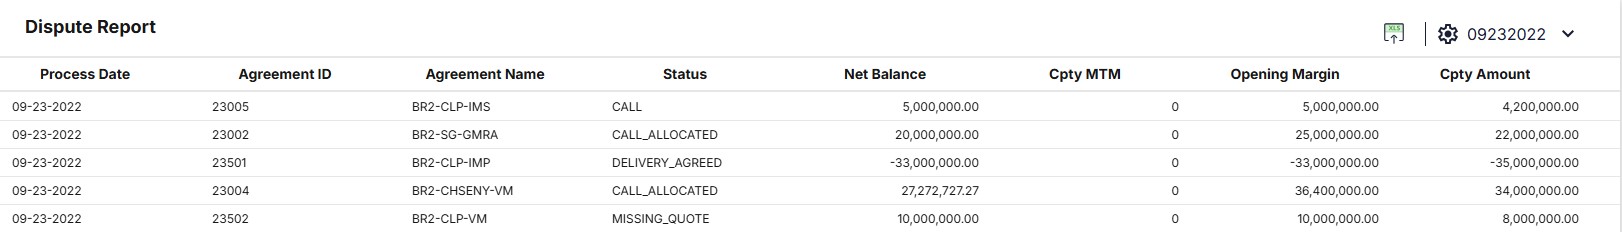
You can click to export the report.
5.3 Allocation Report
Select Reports > Allocation to view the Allocation report.
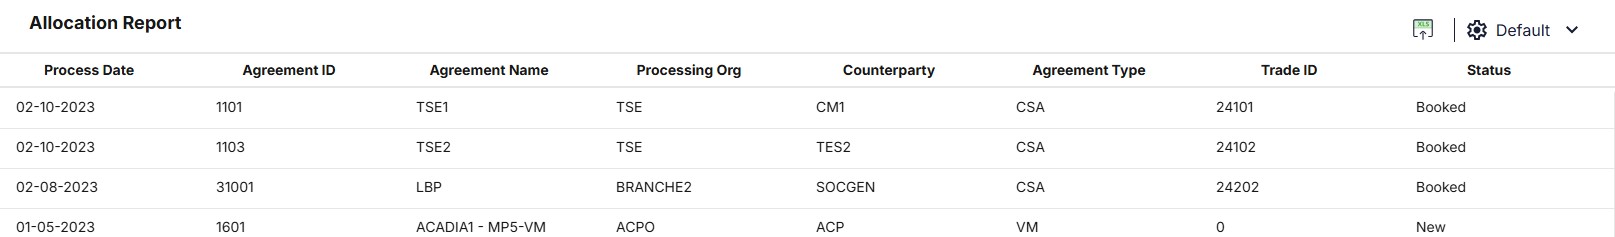
You can click to export the report.
5.4 Balance Report
Select Reports > Balance to view the Balance report.
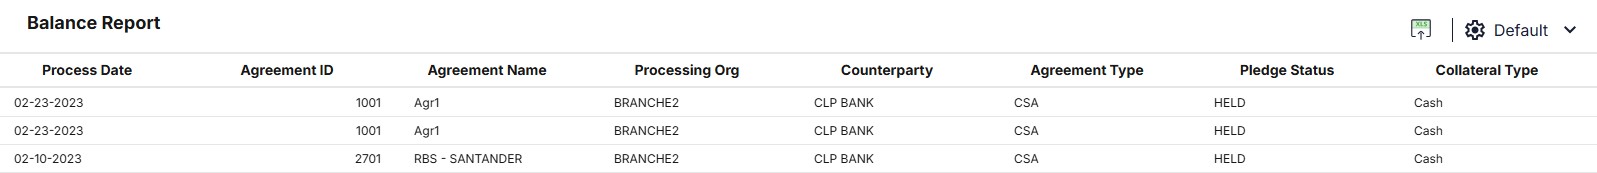
You can click to export the report.
6. Admin
6.1 Configuration
The Default Currency for the Dashboard is set in Admin > Configuration.
It is used to convert all the calls into a single currency for consistent display.
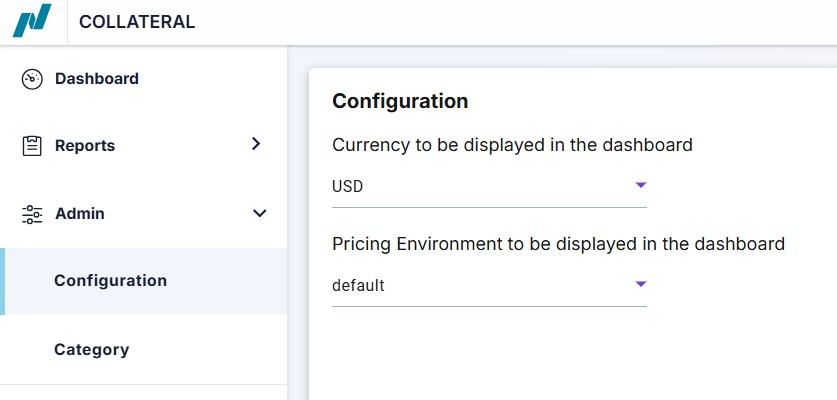
| » | Select the default currency. It defaults to the User Defaults currency. |
| » | Click Save to save your changes. |
6.2 Category
In Admin > Category, you can map status codes to categories and define the next owner action.
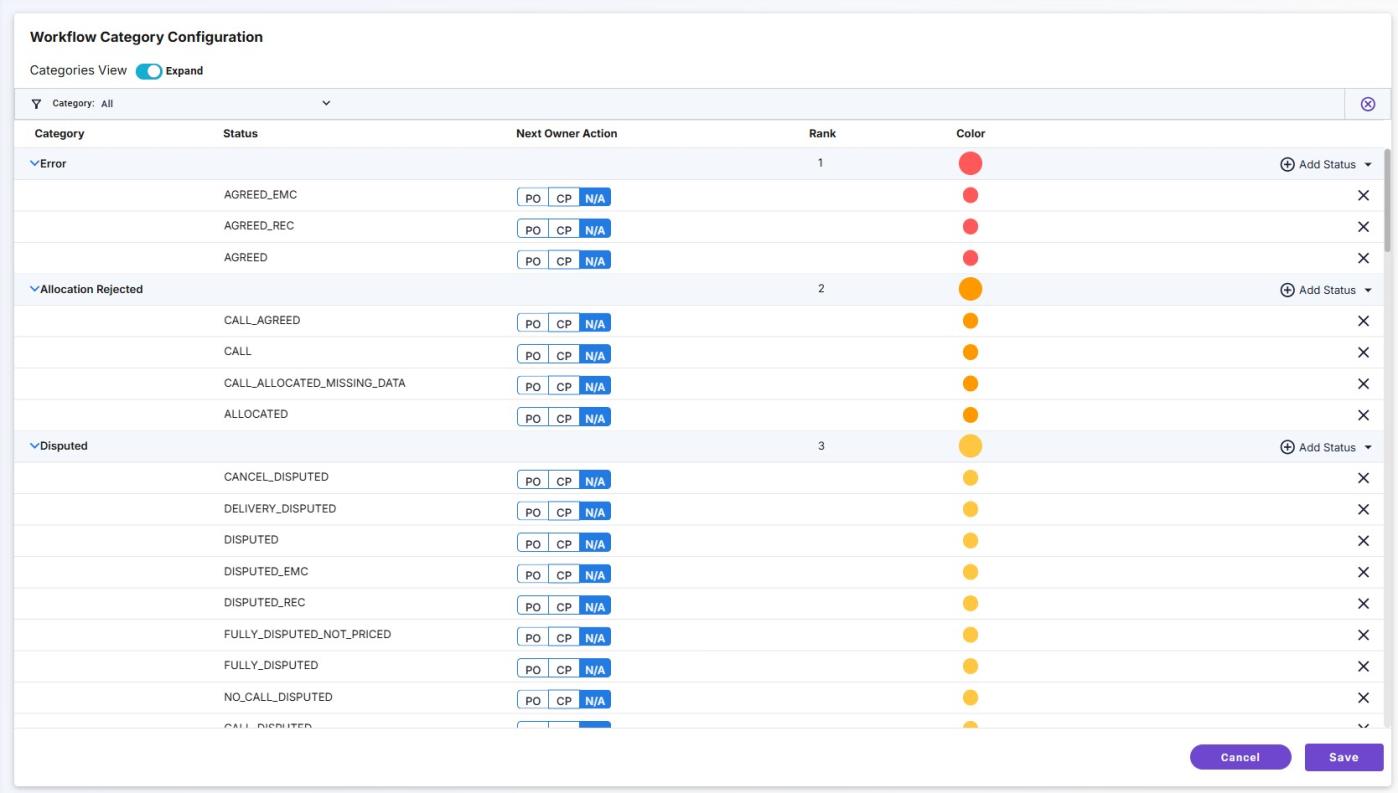
For each category, click Add Status to add the corresponding statues.
For each status, designate the Next Owner Action:
| • | PO: Our actions |
| • | CP: Their actions |
| • | N/A: No Action Required |
Click Save to save your changes.
The rank of each category determines the color indicator that will appear in the widgets.
![]()