Calibration
Choose Analytics > Calibration to perform on-the-fly calibration. It brings up the Calibration window, described below. Once you save a user-defined calibration scheme with the trade, the trade will use it to price the trade. It will no longer use the default calibration.
1. Template
On the left-hand side, the template represents the list of instruments used to calibrate the model. By default, the instruments are European swaptions that make up the Bermudan exercise schedule. You can drill down to the details and modify the parameters as needed.
You can also add and remove instruments from that list using
the ![]() and
and  icons.
You can always reload the default Bermudan schedule using the
icons.
You can always reload the default Bermudan schedule using the ![]() icon.
The list of instruments that can be added depends on the calibration model
implementation.
icon.
The list of instruments that can be added depends on the calibration model
implementation.
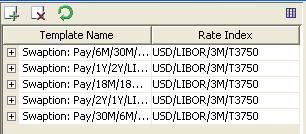
You can choose to display additional columns for more
information using the ![]() icon. For example,
you can add the Rate Index column. You can change parameters in any column.
icon. For example,
you can add the Rate Index column. You can change parameters in any column.
The template will be saved when you save the calibration.
2. Results
All the panels on the right-hand side display the results of the calibration. They are described below.
You can select which panels you want to display from the View field. Each panel operates independently and can be moved around, or rearranged according to your needs.
| » | Click a panel heading, and select whether to view it as a new horizontal panel, or as a new vertical panel. |
Ⓘ [NOTE: If you remove some panels and recalibrate, the results in those panels will not be computed. To compute the results in those panel, you need to add them back, and calibrate again]
3. Calibration Process
Add calibration instruments on the left-hand side and modify their parameters as needed, then click Calibrate.
The system will compute Kappa to reflect the sensitivity of the mean reversion, and Sigma to reflect the sensitivity of the volatility.
If you set a fixed value for the MEAN_REV pricing parameter in the trade, only Sigma will be computed.
If you set a fixed value for the MODEL_VOL pricing parameter in the trade, only Kappa will be computed.
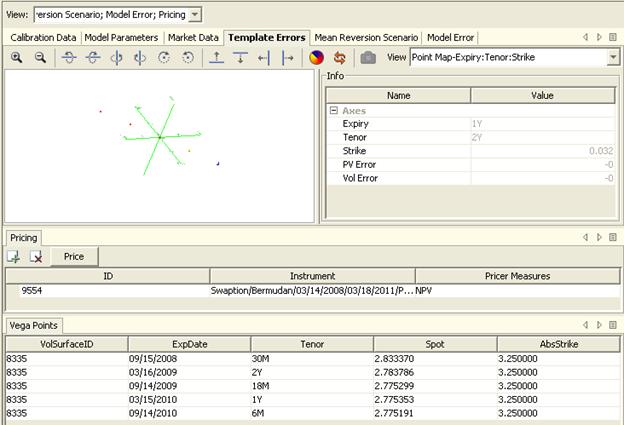
Vega Points
It shows the points on the volatility surface to which the trade will have sensitivities.
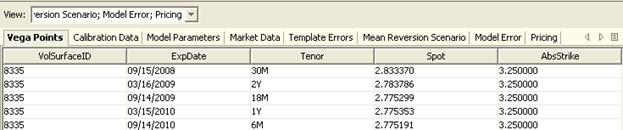
| » | You can drag and drop columns to change their display order. |
Calibration Data
The calibration shows the model volatility against the Black volatilities.
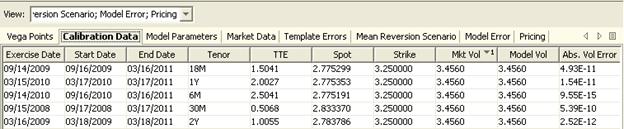
| » | You can drag and drop columns to change their display order. |
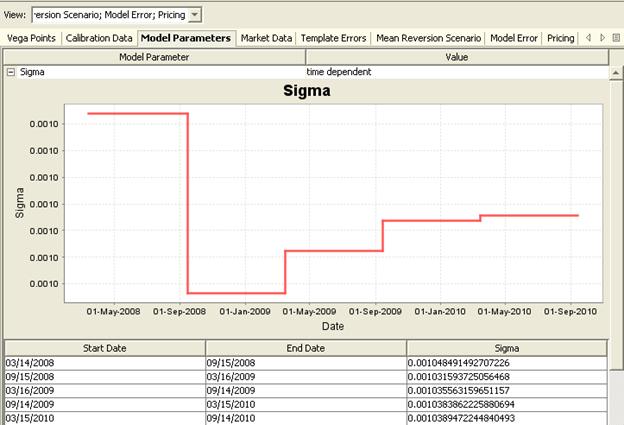
Model Parameters
It shows the computed Sigma and Kappa – You can drill down to view details.
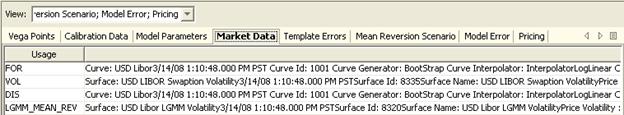
Market Data
This panel displays the market data used to calibrate the trade.
Template Errors
It displays the percentage of error when pricing the calibration instruments against the Black pricer.
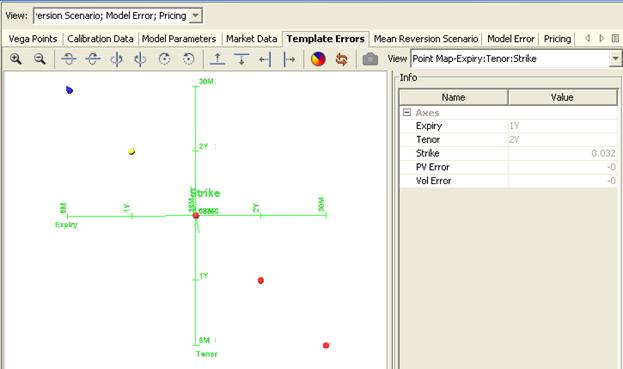
| » | You can select individual points to view individual errors. |
Template errors are stored in a hypersurface structure.
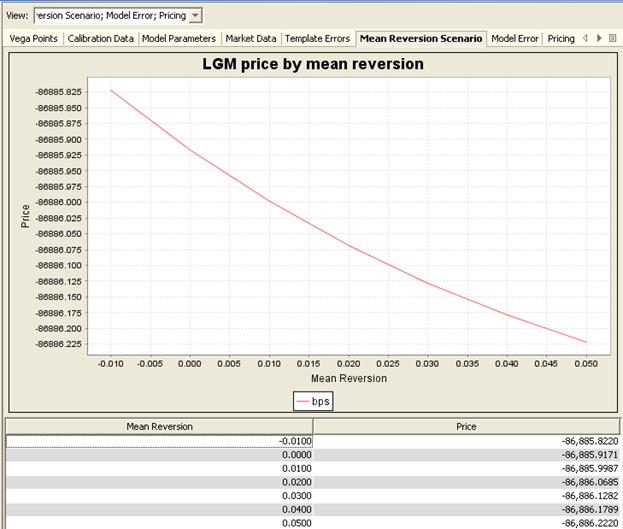
Mean Reversion Scenario
It allows viewing the price by mean reversion. The pricer will do additional valuation, specifically, will vary the constant mean reversion parameter and recompute the NPV.
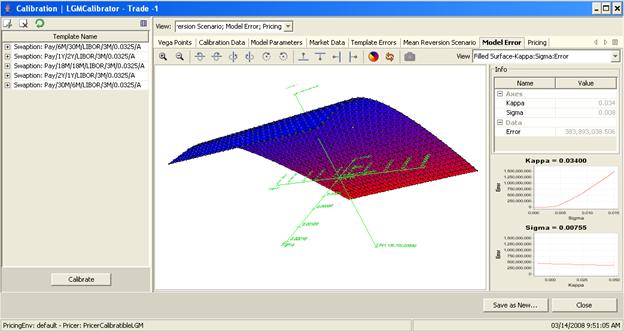
Model Error
It shows the model errors with respect to changes in Sigma and Kappa.
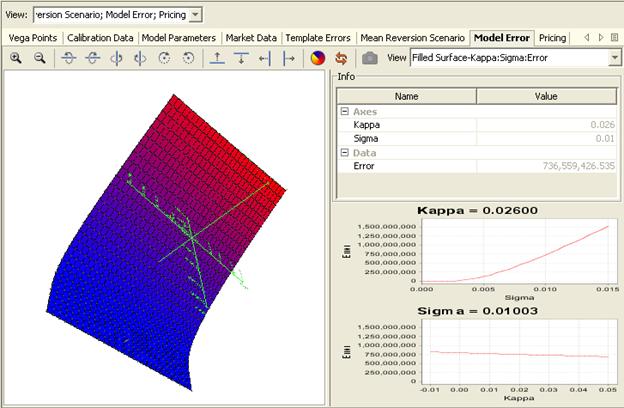
| » | You can select individual points to view individual errors. |
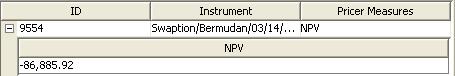
Pricing
You can add trades to be priced using the same calibration parameters, and add pricer measures. This sample implementation currently only supports NPV.
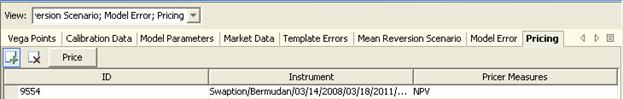
| » | Click Price to compute the selected pricer measures. You can then drill down to the results. |
| » | Click |